niennien260
Nov 12, 2017
Writing Feedback / The pie charts show the expenditure of a school in the UK in three separate years over 20 years [8]
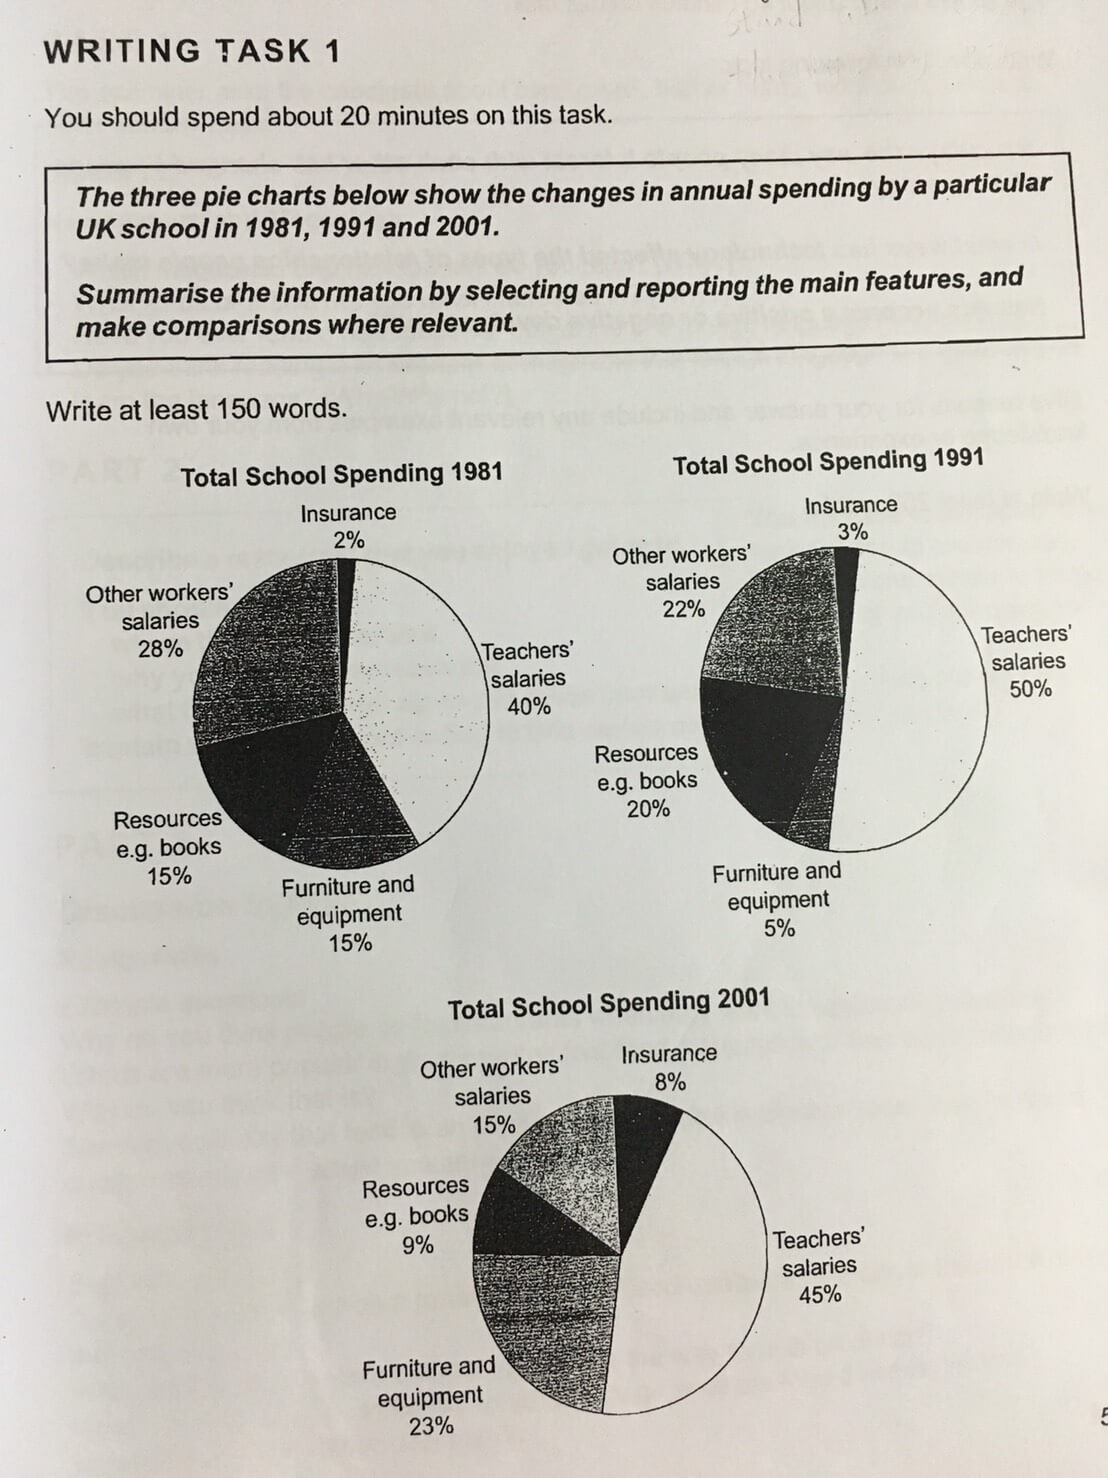
The pie charts show the expenditure of a school in the UK in three separate years over a 20-year period.
It is clear that the majority of the school budget went on teacher's salaries.By contrast,the percentage of insurance's spending steadily remained the lowest.
In 1981,the cost on teachers' salaries represented 40%,than reached to 50% in 1991,but ended up in 45% in 2001.Overall,there was a fluctuation on the expenditure of teachers' salaries over the span of twenty years.The spending of insurance showed a rising trend throughout the 20-year period,growing from 2% to 8% by 2001.
The cost for furniture and equipment fluctuated over the period.It stood at 15% in 1981,declined by 10% in 1991,finally rose to 23% in 2001.Overall,there was an increase.In contrast,the proportion of spending on resources showed a decrease.It also fluctuated throughout the twenty years,but it strated at 15%,slightly increased by 5% in 1991,and finally went down at 9% in 2001.
uk schools budget expedintures
The pie charts show the expenditure of a school in the UK in three separate years over a 20-year period.
It is clear that the majority of the school budget went on teacher's salaries.By contrast,the percentage of insurance's spending steadily remained the lowest.
In 1981,the cost on teachers' salaries represented 40%,than reached to 50% in 1991,but ended up in 45% in 2001.Overall,there was a fluctuation on the expenditure of teachers' salaries over the span of twenty years.The spending of insurance showed a rising trend throughout the 20-year period,growing from 2% to 8% by 2001.
The cost for furniture and equipment fluctuated over the period.It stood at 15% in 1981,declined by 10% in 1991,finally rose to 23% in 2001.Overall,there was an increase.In contrast,the proportion of spending on resources showed a decrease.It also fluctuated throughout the twenty years,but it strated at 15%,slightly increased by 5% in 1991,and finally went down at 9% in 2001.

