Asih Mustikasari
Sep 9, 2018
Writing Feedback / IELTS Task 1 : the table below shows the figures for imprisonment in five countries 1930-1980 [4]
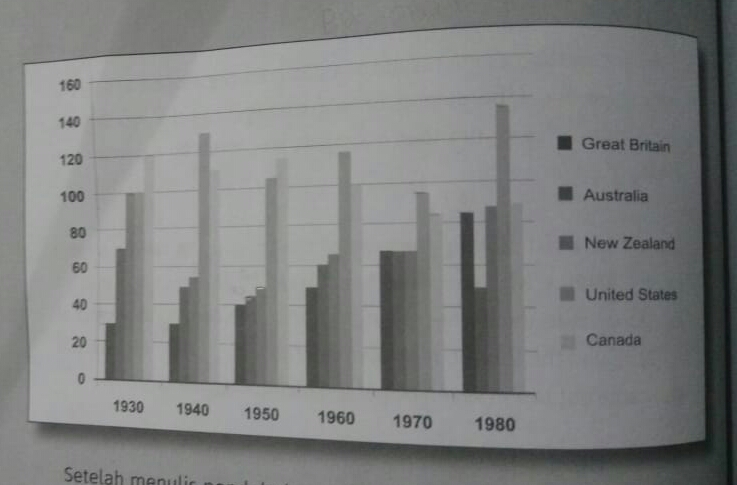
The bar chart illustrates the numbers for imprisonment over a period of 50 years in Great Britain, Australia, New Zealand, United State, and Canada. They pivot represents amounts of prisoners in thousands.
Five countries from 1930 to 1980 show some dramatic fluctuations, such as New Zealand, its prisoners come to 100,000 in 1930, then in 1940 fall in 55,000, and in 1950 fall again to 50,000. For the other three, year 1960. 1970, and 1980 New Zealand bear 65,000, 70,000, and 90,000 prisoners respectively.
In 1970, 95,000 is amount for imprisons of United State, to 135,000 in 1980, the highest of all five countries. While Canada bear prisoners in the range of 120,000 in 1930 to 85,000 in 1970.
Great Britain's prisoners ranged from 85,000, its highest number in 1980, to 30,000 in 1930, the lowest of all five countries. Likewise, prisons of Australia in the range of 70,000 in 1930, to 45,000 in 1950.
the imprisonment rate in some countries across the world
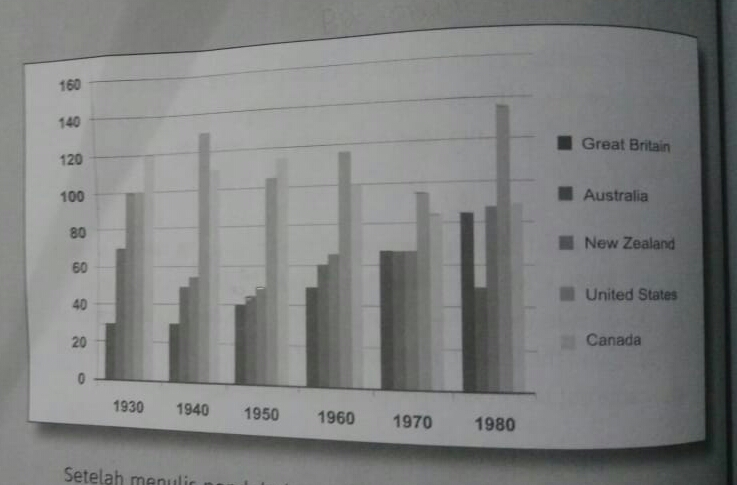
The bar chart illustrates the numbers for imprisonment over a period of 50 years in Great Britain, Australia, New Zealand, United State, and Canada. They pivot represents amounts of prisoners in thousands.
Five countries from 1930 to 1980 show some dramatic fluctuations, such as New Zealand, its prisoners come to 100,000 in 1930, then in 1940 fall in 55,000, and in 1950 fall again to 50,000. For the other three, year 1960. 1970, and 1980 New Zealand bear 65,000, 70,000, and 90,000 prisoners respectively.
In 1970, 95,000 is amount for imprisons of United State, to 135,000 in 1980, the highest of all five countries. While Canada bear prisoners in the range of 120,000 in 1930 to 85,000 in 1970.
Great Britain's prisoners ranged from 85,000, its highest number in 1980, to 30,000 in 1930, the lowest of all five countries. Likewise, prisons of Australia in the range of 70,000 in 1930, to 45,000 in 1950.

IMG20180910WA0005.jpg
