elinita123
Oct 29, 2021
Writing Feedback / IELTS Task 1: PIE CHART - WATER USE PROPORTIONS [4]
Please leave some comments on my writing. Thanks a lot!
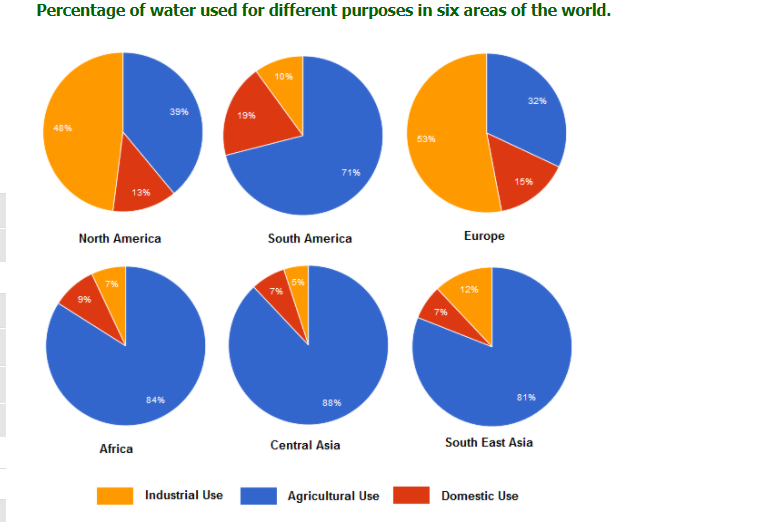
As can be seen, the pie charts compare data on the differences in the proportion of water consumption for agricultural, domestic and industrial purposes in six continents of the world
In general, water for agriculture accounted for the highest percentage in Asian areas, Africa and South America whereas in North America and Europe, water was mainly used for industrial purpose.
To be more specific, the largest proportion of industrial water use can be observed in Central Asia with more than eight-tenths of the total water used. The proportion of industrial water use was lower than the numbers for household purpose with a gap of 2% in Africa and Central Asia and 9% in South America. South East Asia, however, presented the opposite with 12% for industry and only 7% for domestic use.
In terms of North America and Europe, it is obvious that industry sector consumed the highest amount of water, constituting 48% and 53% respectively, Moreover, the water for agriculture in both continents was also larger than the figures of household use, which tripled in North America and more than doubled in Europe.
Please leave some comments on my writing. Thanks a lot!
the percentage of water used for different purposes
As can be seen, the pie charts compare data on the differences in the proportion of water consumption for agricultural, domestic and industrial purposes in six continents of the world
In general, water for agriculture accounted for the highest percentage in Asian areas, Africa and South America whereas in North America and Europe, water was mainly used for industrial purpose.
To be more specific, the largest proportion of industrial water use can be observed in Central Asia with more than eight-tenths of the total water used. The proportion of industrial water use was lower than the numbers for household purpose with a gap of 2% in Africa and Central Asia and 9% in South America. South East Asia, however, presented the opposite with 12% for industry and only 7% for domestic use.
In terms of North America and Europe, it is obvious that industry sector consumed the highest amount of water, constituting 48% and 53% respectively, Moreover, the water for agriculture in both continents was also larger than the figures of household use, which tripled in North America and more than doubled in Europe.

Screenshot_4.png
