mt30
May 27, 2022
Writing Feedback / Ielts task 1: The changes of incident number happened in three areas of crime in Newport city center [2]
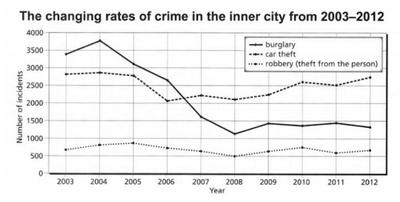
The line chart illustrates the changes of incident number happened in three areas of crime in Newport city center including burglary, car theft and robbery between 2003 and 2012.
Overall, the number of incidents made by car thieves and robbers increased slightly while at the same time, the figure for burglary incident dropped considerably. all of them have some fluctuations. Although rate of burglary incident is highest initially, at the end of period, the number of car theft incident outraced the others.
With regard to the number of car theft incident, it began at about 2800 incidents at the first year before increasing slightly to around 2900 incidents in the next year, and hitting a lower-point of about 2000 incidents in 2006. Then, it witnessed a inconsiderable spike before falling again to around 2001 in 2008 and claimed back gradually to over 2500 in 2010 and reach a peak at about 2750 at the of period. Likewise, about 700 robbery incidents were recorded in the first year and the number increased extremely to approximately 900 incidents in 2005 before falling gradually to about 600 incidents in 2007 and 500 in 2008. In the rest of period, the robbery incident number rose significantly to around 750 in 2010 and the last number recorded was about 525 incidents in 2012.
On the other hand, initially burglary incidents number recorded at almost 3500 in 2003 and reached a peak at around 3750 in the next year. However, the figure dropped gradually and hit a lower-point of about 1200 incidents in 2008. From 2009 to 2011, the number of incidents only fluctuated below 1500 before falling to about 1850 incidents in 2012.
the changing rates of crime in the inner city
The line chart illustrates the changes of incident number happened in three areas of crime in Newport city center including burglary, car theft and robbery between 2003 and 2012.
Overall, the number of incidents made by car thieves and robbers increased slightly while at the same time, the figure for burglary incident dropped considerably. all of them have some fluctuations. Although rate of burglary incident is highest initially, at the end of period, the number of car theft incident outraced the others.
With regard to the number of car theft incident, it began at about 2800 incidents at the first year before increasing slightly to around 2900 incidents in the next year, and hitting a lower-point of about 2000 incidents in 2006. Then, it witnessed a inconsiderable spike before falling again to around 2001 in 2008 and claimed back gradually to over 2500 in 2010 and reach a peak at about 2750 at the of period. Likewise, about 700 robbery incidents were recorded in the first year and the number increased extremely to approximately 900 incidents in 2005 before falling gradually to about 600 incidents in 2007 and 500 in 2008. In the rest of period, the robbery incident number rose significantly to around 750 in 2010 and the last number recorded was about 525 incidents in 2012.
On the other hand, initially burglary incidents number recorded at almost 3500 in 2003 and reached a peak at around 3750 in the next year. However, the figure dropped gradually and hit a lower-point of about 1200 incidents in 2008. From 2009 to 2011, the number of incidents only fluctuated below 1500 before falling to about 1850 incidents in 2012.

ieltslinegraphcha.jpg
