pthanh_0419
Jun 20, 2024
Writing Feedback / Essay about the money spent by British parents (Ielts writing Task 1 ) [2]
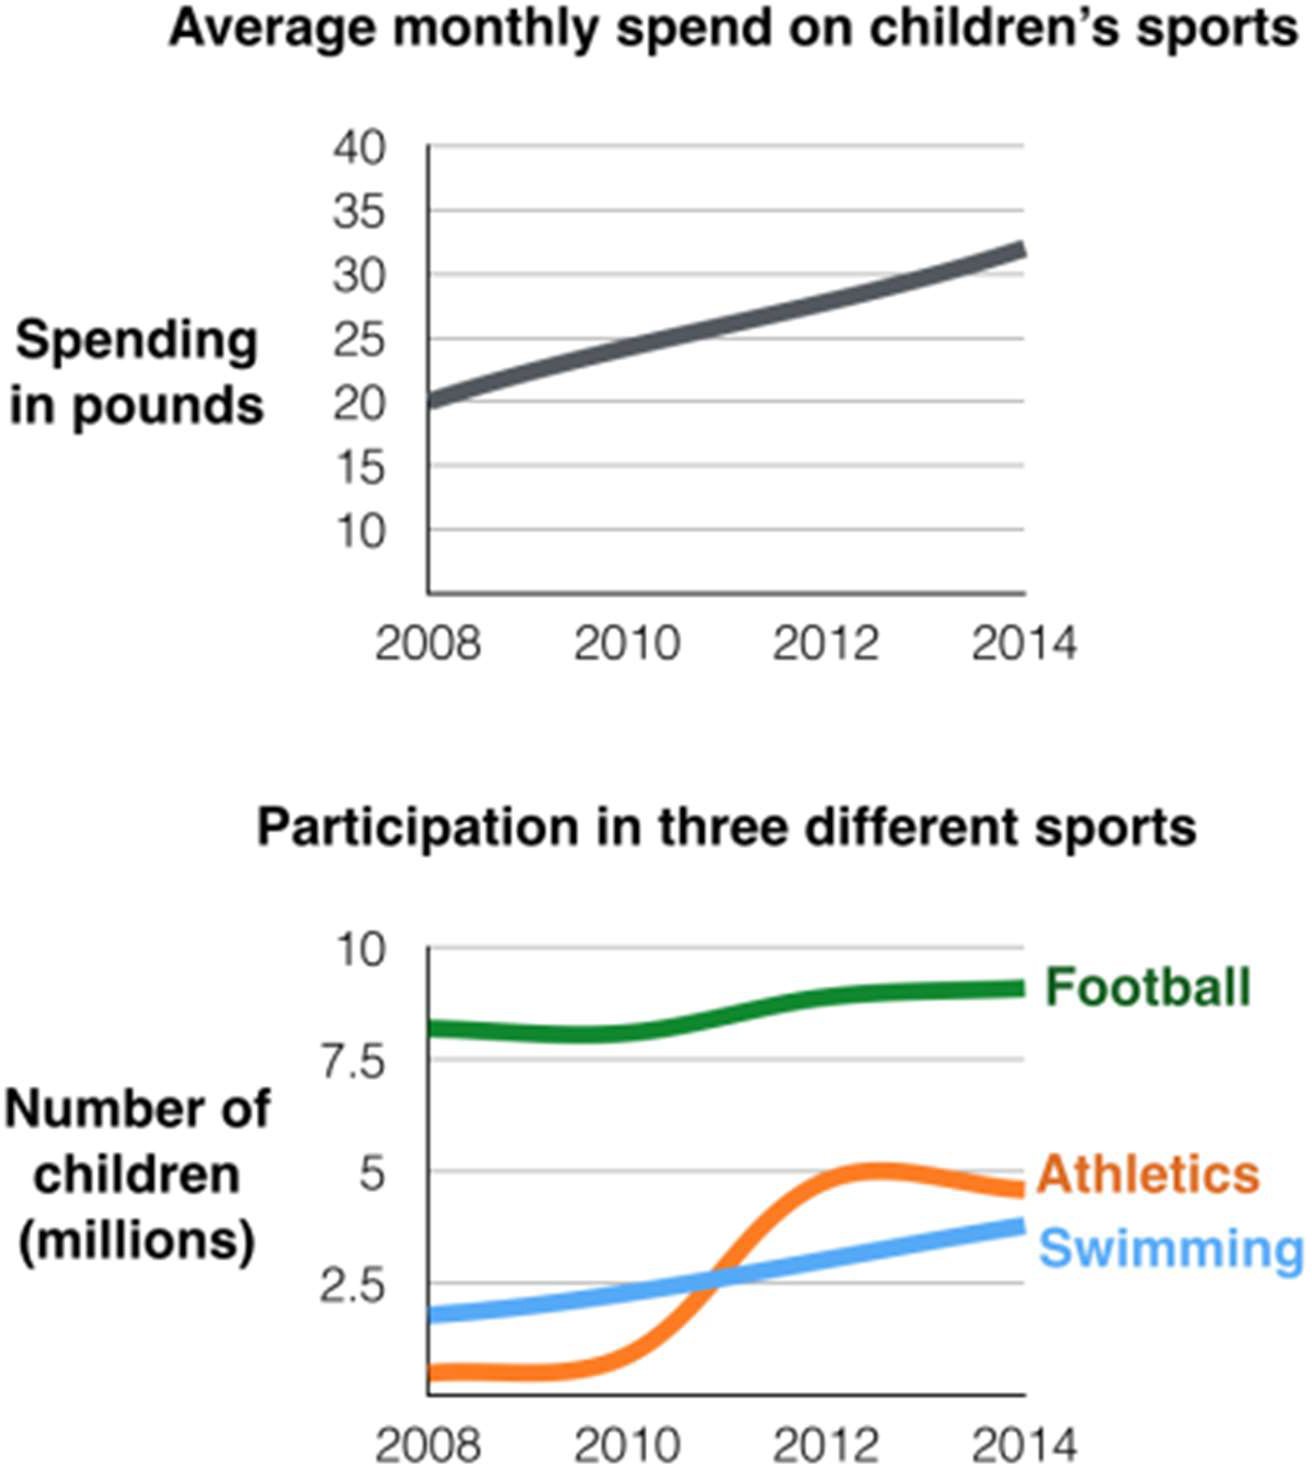
The first chart below gives information about the money spent by British parents on their children's sports between 2008 and 2014. The second chart shows the number of children who participated in three sports in Britain over the same time period.
The first given line graph illustrates average monthly expenditure by British parents on their children's sports from 2008 to 2014 . The second line graph shows the popularity of three distinctive sports ,namely football , athletics and swimming , among British children over the same period .
Overall, it is evident that both the expenditure on children's sports and the participation in the three sports showed an upward trend throughout the period . Furthermore, football was consistently the dominant sport among the three.
In 2008, British parents allocated around 20 pounds every month on their children's sports. This figure increased steadily over the years , rising by about 5 pounds from 2008 to 2010 . The growth continued at a more moderate pace, with incremental increases of roughly 3 pounds every two years, culminating in a peak of 30 pounds per month in 2014.
Regarding the participation in the three sports , football had the highest number of participants, fluctuating between 8 and 8.75 million children over the period . Notably , it was significantly higher than those in athletics and swimming combined . Besides , the number of children enrolled in swimming was about 2.5 million initially , higher than those participating in athletics by about 2 million from 2008 to 2010 , followed by a substantial rise afterwards . However, participation in athletics rose rapidly, reaching almost 5 million in 2012 ,surpassed those in swimming in the last two years.

1212.jpg
