sukhjit
Aug 1, 2013
Writing Feedback / IELTS: Table graph writing, modes of travelling in England. [2]
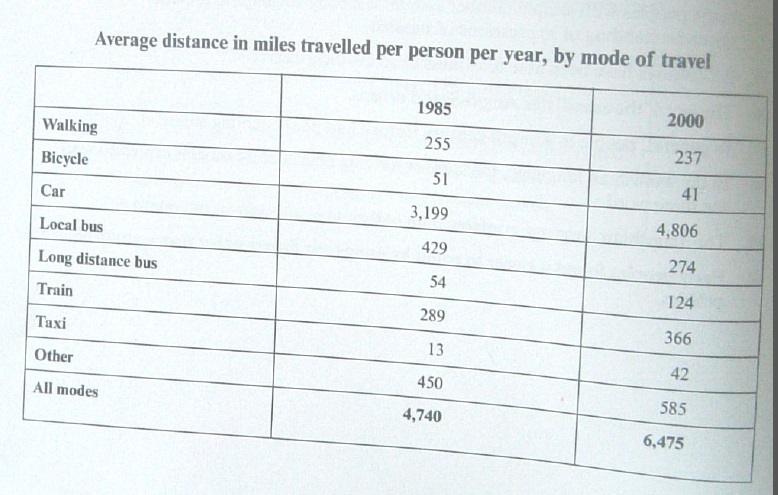
Topic: The table below gives information about changes in modes of travel in England between 1985 and 2000. Summarize the information by selecting and reporting the main features and comparison where relevant.
The statistical data of table graph reveals the different modes of traveling in England between the years of 1985 and 2000.
In 1985, average distance distance traveled per person by walking was 255 miles, that was nearly followed by trains and approximately five times higher than the bicycle and long distance traveling. Distance traveled in local buses and other modes was 429 miles and 450 miles respectively. Cars covered maximum distance that was 3199 miles and lowest went to taxi that was merely 13 miles.
Likewise, in the end of 20th century, again cars denoted maximum proportion of distance that was 4806 miles, whereas the lowest distance recorded at 41 miles by the bicycle. Through walking, a person traveling 237 miles, that was almost half of second highest distance traveled by other modes. The local bus and train used to travel 274 miles and 366 miles respectively.
Overall, the total distance traveled by all modes was 4740 miles however in 2000, it increased to 6475 miles.

Table Graph
