Karlito
Jan 22, 2014
Writing Feedback / The proportion of the population aged 65 and over between 1940 and 2040. Writing Task 1 [5]
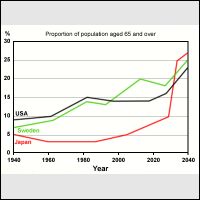
The graph shows the percentage of total number of inhabitants in different areas between 1940 and 2040 with aged 65 and over.
First of all, consider the period from 1940 to 2000. In this period the USA peaked with the highest percentage of population aged 65 and over only with 15%. But at the same time the percentage in Sweden has a small difference by 2 %.
After that, in 2010 the total number of such people in Sweden increased to 20%. Although, an interval in the USA of this time did not change.
Moreover, in the whole period Japan rose slightly from 5% to 10%. But in the end in 2030 the proportion of the age climbed sharply to 25%.
In conclusion, we can see that Japan the most popular centenarians nowadays and they have the greatest percentage of people who are over 65 years old with 27% .Besides, the proportion of ageing population in USA and Sweden will be predicted to rise such as Japan.
(167 words)

221736_1.jpg
