rockmanvnx6
Jan 28, 2014
Writing Feedback / IELTS: outlay and expense on fast foods in the UK [5]
The chart below shows the amount of money per week spent on fast foods in Britain.
The graph shows the trends in consumption of fast foods.
Write a report for a university lecturer describing the information shown below .
___
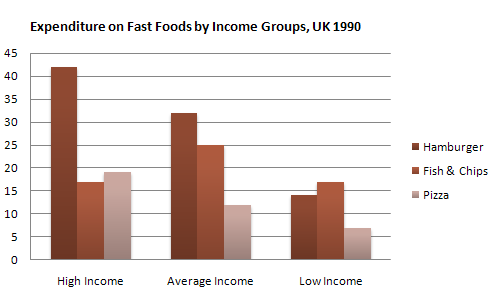
The bar chart illustrates the outlay on fast foods in the UK in 1990 whereas the line graph gives information about the figure for the consumption of fast food from 1970 to 1990 as indicated on the x-axis .
Overall , people in the UK spend a lot of their money on hamburger but their consumption of fish and chips is the highest .
It can be seen clearly from the barchart that in the high income group , the budget for hamburger came first with 42 pence while that for fish and chips was only 16 pence . In the average income group , the spending money on hamburger witnessed a significant drop from 42 pence to 32 pence . In contrast , the expenditure on fish and chip rose considerably from 16 pence to 25 pence . On the other hand , in the low income group , people spent their money on fish and chip more than hamburger .
Moving to the linegraph , the consumption of hamburger rose dramatically from 80 grammes to 500 grammes between 1970 and 1990 while that of pizza experienced a marked reduction from 300 to 200 in 15 years . After that , there is a slight climb in the consumption of pizza from 1985 to 1990

ielts1.gif
ielts2.gif

