minhvo
Apr 17, 2014
Writing Feedback / IELTS task 1- summarize charts information budget allocation [4]
It is quite a challenge for most of us when it comes to control your budget allocation especially for households with middle incomes. The spending trend itself had considerably changed throughout 2010 to 2012.
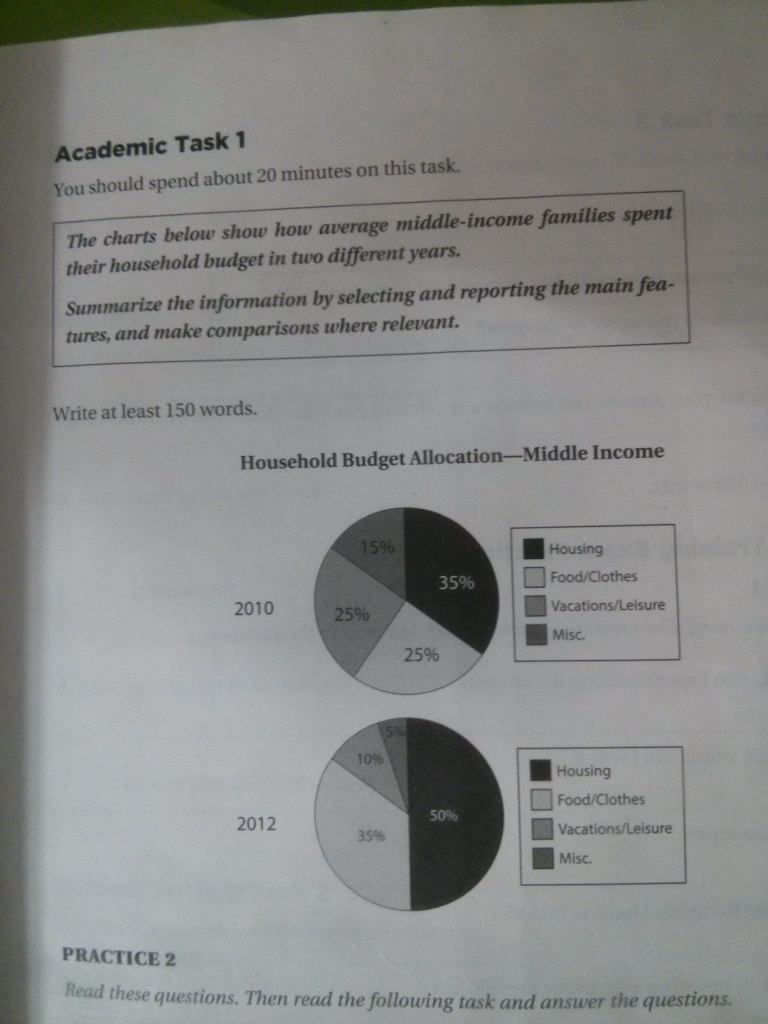
As seen on the charts above, housing can be considered had some significant changes. An increase of 15% compare to 2010 budget's data, making it the largest budget in all 4 categories.
Another increase in spending as we have seen on the charts is food/clothes category. While the data showed on 2010 chart is 25%, in 2012, its put forward that people had spent 10% more, turning the category into the second largest allocation.
As two categories increased, there're also some of them had decreased tremendously. One of which is the category with vacation or leisure purpose. It clearly presents that the category had suffered a decline of 15% since it was 25% in 2010 and 10% in 2012. Misc category is also not an exception when it had went from 15% in 2010 to 5% in 2012.
In conclusion the charts put forward a few growth of spending in such category like housing, food, clothes while other categories which serve for leisure and other purposes had decreased substantially.
this is my very first ielts writing, i hope you guys would help me

