ChingTang
Dec 1, 2016
Writing Feedback / Who was more eager to get an advanced education? Men, women and after full or part-time education? [2]
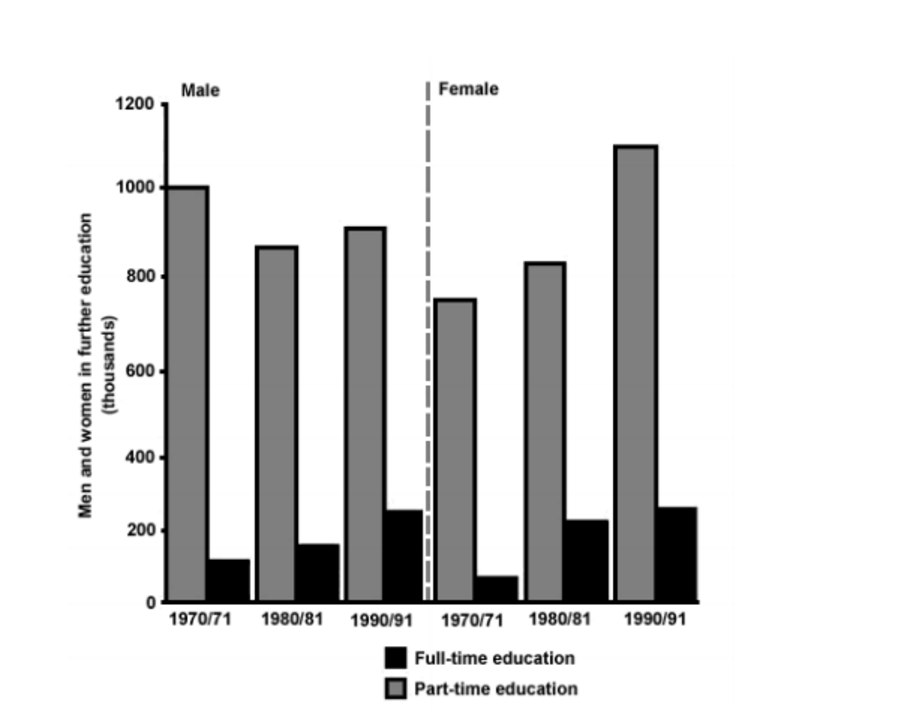
The bar chart illustrates the numbers of people who got an advanced education between men and women with comparing full-time education and part-time education from 1970 to 1991.
It was clearly different between the numbers of full-time education and part-time education. There is an incredible difference that people got much more further part-time learning than full-time learning. On the other hand, the chart tells us the numbers of men in part-time education decrease compared to 1970 to 1991; whereas the numbers of women increased year by year. However, there was a same situation between males and females in full-time education- the number of education rose apparently in the period, especially in females.
According to the bar chart, we are informed men who had further part-time studying were more than women in 1970/71, 1000 thousands and about 750 thousands individually. Nevertheless, the situation reversed in 1990/91. The biggest difference is in the part-time schooling, that approximately 900 thousands of males had, compared with 1100 thousands of females did.

.png
