chikachika
Mar 8, 2017
Writing Feedback / IETLS Writing task 1 - 'Parkway Hotel customer service' pie chart [4]
Thank you for spending time reading my post. I really appreciate your helps.
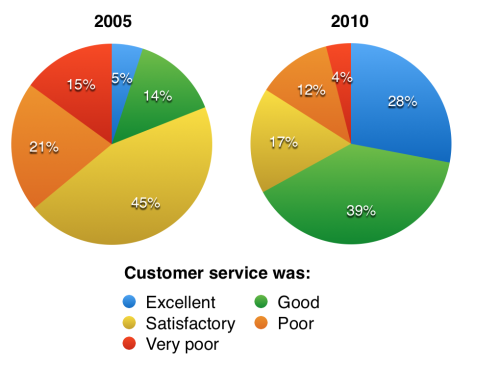
The charts below show the results of a questionnaire that asked visitors to the Parkway Hotel how they rated the hotel's customer service. The same questionnaire was given to 100 guests in the years 2005 and 2010.
The pie charts compare between the results of customer service evaluation surveys conducted in 2005 and 2010 in Parkway Hotel.
Overall, there were significant changes after a 5-year period. In 2005, more than two third of the customers were satisfied with the quality of customer services, the number increased dramatically to roughly 85% in 2010, only a minority of visitors gave out negative responses.
In 2005, nearly half of the customers rated customer service as satisfactory and only 5% of customers considered their jobs were excellent. However, the situation was reversed in 2010, the respectively figure for excellent and satisfactory option are 28% and 17%. The percentage of visitors who felt good about customer service rose a quarter more after 5 years of development.
In 2010, roughly 15% of visitors were unsatisfied with the Parkway's service. However, compared to 2005, the figure for "very poor" option was 15%, not to mention that of ''poor '' option, which accounted for 21% of customers.
Thank you for spending time reading my post. I really appreciate your helps.
quality of service in a hotel
The charts below show the results of a questionnaire that asked visitors to the Parkway Hotel how they rated the hotel's customer service. The same questionnaire was given to 100 guests in the years 2005 and 2010.
The pie charts compare between the results of customer service evaluation surveys conducted in 2005 and 2010 in Parkway Hotel.
Overall, there were significant changes after a 5-year period. In 2005, more than two third of the customers were satisfied with the quality of customer services, the number increased dramatically to roughly 85% in 2010, only a minority of visitors gave out negative responses.
In 2005, nearly half of the customers rated customer service as satisfactory and only 5% of customers considered their jobs were excellent. However, the situation was reversed in 2010, the respectively figure for excellent and satisfactory option are 28% and 17%. The percentage of visitors who felt good about customer service rose a quarter more after 5 years of development.
In 2010, roughly 15% of visitors were unsatisfied with the Parkway's service. However, compared to 2005, the figure for "very poor" option was 15%, not to mention that of ''poor '' option, which accounted for 21% of customers.

yugu.png
