Writing Feedback /
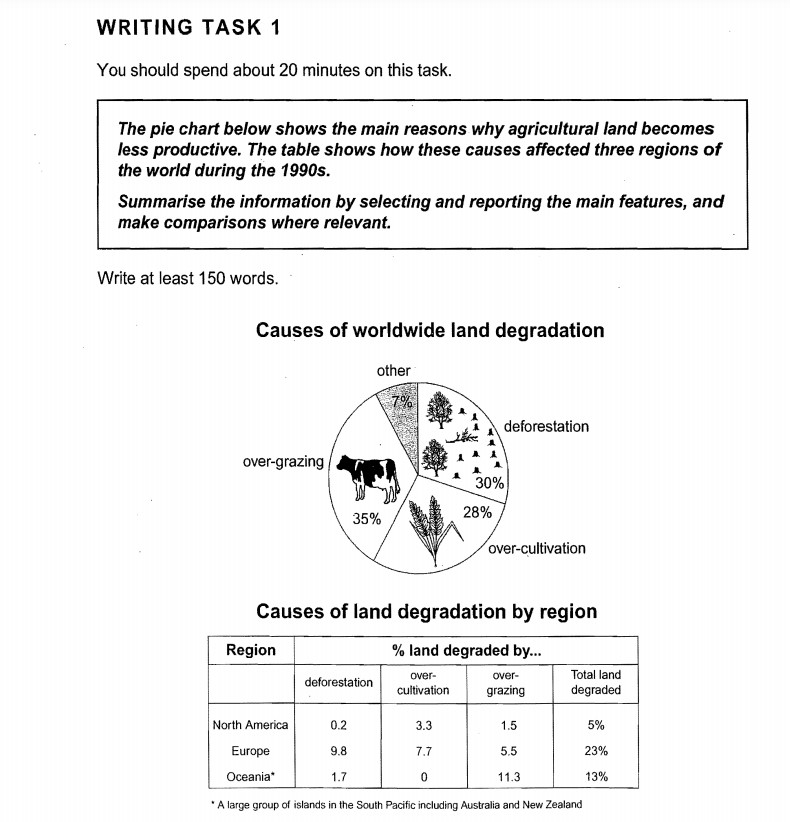
IELTS TASK1 The diagrams show causes of land degradation and percentages in three regions. [4]
IELTS TASK1 TOPIC: The pie chart below shows the main reasons why agricultural land becomes less productive. The table shows how these causes affected three regions of the world during the 1990s.Summarise the information by selecting and reporting the main features, and make comparisons where relevant.
MY ESSAY:
The pie chart illustrates the main causes of land degradation, deforestation, over-cultivation and over-grazing, and the table shows the percentages of each cause in three different areas in the 1990s, namely North America, Europe and Oceania.
There are three obvious phenomena that bring about less productivity of farming land, over- grazing takes the biggest portion, with figure of 35%. Following by deforestation and over-cultivation, with very close figures of 30% and 28% respectively.
It is clear that Europe had the worst situation among three regions during the 1990s, having 23% of land degradated, While only 5% of the agricultural land was damaged in North America during the same period, and the figure for Oceania region was 13% in total.
Each region had different proportions of the causes of land degradation in the 1990s. First of all, over-cultivation took the most responsibility for land degradation in North America, having 3.3% out of the total 5%. In Europe, the biggest cause which made the land infertile was deforestation, but over-cultivation affected the condition as well, with figure of 7.7%. Finally, Oceania had the most extreme figures for each cause, over-grazing accounted for 11.3%, but only 1.7% of land was destructed by deforestation, and no over-cultivation happened there in the 1990s.

81task1.jpg

