Unanswered [2] | Urgent [0]
  

Posts by hahalolo [Suspended]
Name: hahalolo
Joined: Aug 15, 2021
Last Post: Sep 14, 2021
Threads: 1
Posts: 5  
From: Malaysia
School: HNUE

Displayed posts: 6
sort: Latest first   Oldest first  | 
hahalolo   
Aug 21, 2021
Writing Feedback / The line graph illustrates both fossil fuel energy and clean energy consumption in the USA [4]

It is recommended that you indicate the report of the past in the first graph, and the prediction in the second graph to keep it coherent.

As one of the tasks in Writing task 1 is make comparisons where relevant, you must clarify the different between figures, not describe them separately.
For instance, you can compare the amount of energy consumed in 1980 (in 1980, petrol and oil was the dominant type of energy with..., followed by natural gas and oil, ect) instead of indicate them one by one like Petrol and Oil started at.
hahalolo   
Aug 21, 2021
Writing Feedback / IELTS WRITING TASK 1: The line graph shows the number of single-family homes in the United States... [4]

The phrase A glance at the graph reveals that sounds unnatural and informal in a Writing task 1 since it is overused by many English centre. You should replace it with phrases such as It is noticeable that.

Too formal and academic words like nadir (it experienced a dramatic collapse before reaching the nadir in 2010) are not expected in Writing task 1 also. I would use the lowest rate/point

As there is a same downward pattern in all regions from 2006 to 2010, you should describe the change between 2006 and 2010 in the first graph, and the remaining period in the second graph in order to stay coherent.
hahalolo   
Aug 20, 2021
Student Talk / What's the biggest writing fail in your writing? [26]

I can not come up with difficult and complex grammar structures as well as vocabulary whenever I'm writing. Thus, my writing always look simple and directly affect to the evaluation.
hahalolo   
Aug 15, 2021
Writing Feedback / IELTS Writing Task 1 : The average house expenses in England and its capital city – London [2]

house prices in England


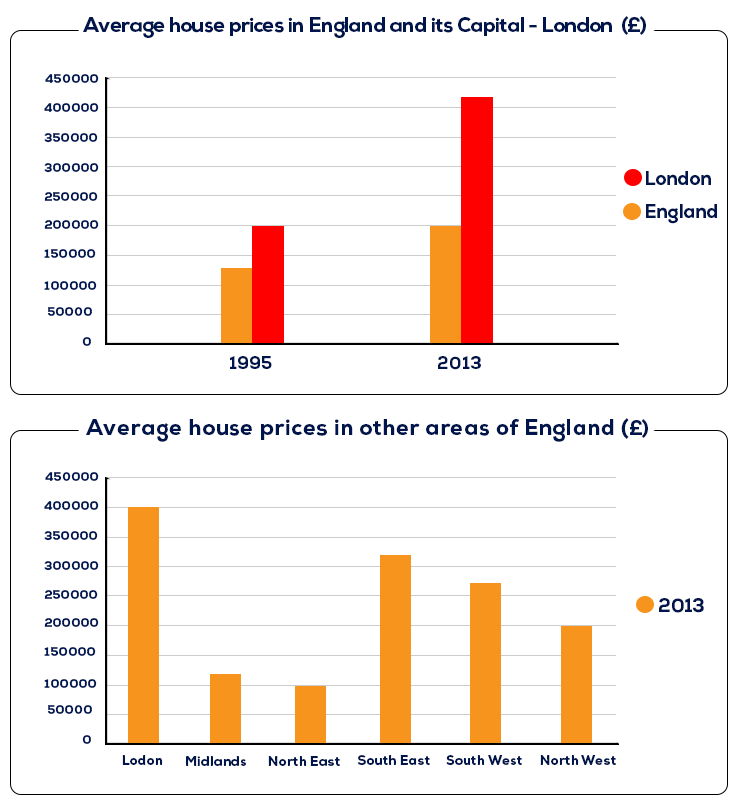
The bar charts below illustrate the average house prices in England and some other areas of England including its capital city London.
Overall, in 1995 and 2013, the average cost for houses in London was generally higher than that in England. In addition, the housing expenses in Midlands and North East were the lowest among distinct regions in 2013.

According to the data, in 1995, people in England wanting to own a house must normally pay nearly 150.000£, meanwhile, to possess a house in London, dwellers need to pay a little higher, about 200.000£. During the 18-year period, London witnessed a dramatic rise in accommodation prices with averagely 400.000£ per house, which doubled the housing cost in England.

It can be seen that in 2013, the accommodation expense in London was the highest out of 6 different regions, followed by South East and South West with over 300.000£ and over 250.000£ respectively. North West was the only region that shared the same average house prices with England, which was 200.000£, whereas the cost to buy a house was noticeably lower in Midlands and North East, the house expense of Midlands was over 100.000£ meanwhile the figure for North East was 100.000£.


  • full_dethiieltswr.png
Need Writing or Editing Help?
Fill out one of these forms:

Graduate Writing / Editing:
GraduateWriter form ◳

Best Essay Service:
CustomPapers form ◳

Excellence in Editing:
Rose Editing ◳

AI-Paper Rewriting:
Robot Rewrite ◳

Academic AI Writer:
Custom AI Writer ◳