Luana1017
Nov 28, 2022
Writing Feedback / (Writing Task 1) The proportion of smokers in males and females [2]
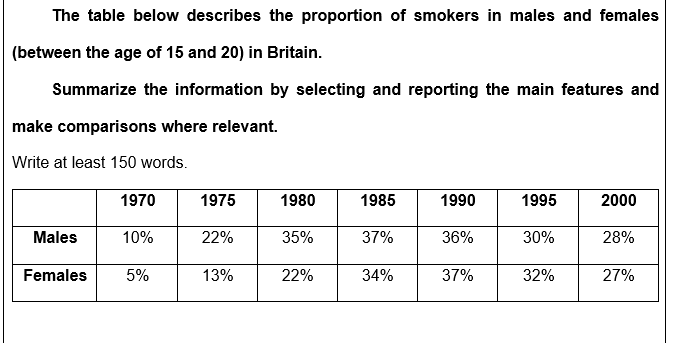
The table gives information about the proportion of males and females who smoked in Britain during the period 1970 to 2000.
It is clear that the proportion of smokers in males was higher than in females in Britain. From 1970 to 2000, the figures increased significantly. However, the proportion of males who smoked underwent more considerable growth.
The percentage of smokers in males was 10% in 1970 in Britain. After that, the figure rose dramatically and reached the highest point of 37% in 1985. Following that, this proportion fell gradually, which declined by 9% from 37% to 28% between 1985 and 2000.
The proportion of males who smoke was smallest in 1970, at 5%. Over the period of 20 years, the percentage grew substantially and reach a peak at 37% in 1990 and then overtook the figure for females. Finally, males saw a decrease in the proportion of smokers by 10% (from 37% to 27%) from 1990 to 2000, which was similar to the percentage of males.
The proportion of smokers in british society
The table gives information about the proportion of males and females who smoked in Britain during the period 1970 to 2000.
It is clear that the proportion of smokers in males was higher than in females in Britain. From 1970 to 2000, the figures increased significantly. However, the proportion of males who smoked underwent more considerable growth.
The percentage of smokers in males was 10% in 1970 in Britain. After that, the figure rose dramatically and reached the highest point of 37% in 1985. Following that, this proportion fell gradually, which declined by 9% from 37% to 28% between 1985 and 2000.
The proportion of males who smoke was smallest in 1970, at 5%. Over the period of 20 years, the percentage grew substantially and reach a peak at 37% in 1990 and then overtook the figure for females. Finally, males saw a decrease in the proportion of smokers by 10% (from 37% to 27%) from 1990 to 2000, which was similar to the percentage of males.

Smokers.png
