Writing Feedback /
IELTS 1: Goods transported in the UK from 1974 to 2002 by four modes of transport [2]
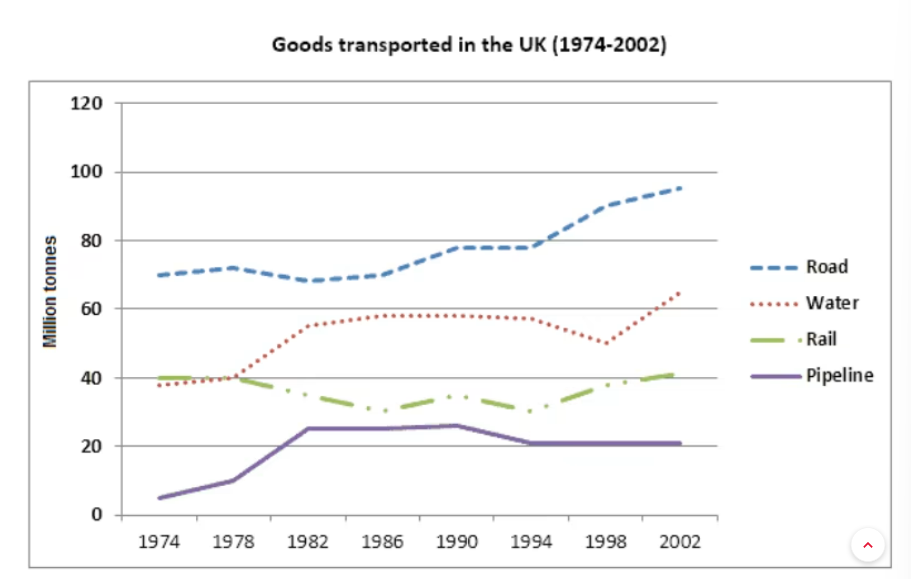
THE GRAPH BELOW SHOWS THE QUANTITIES OF GOODS TRANSPORTED IN THE UK FROM 1974 TO 2002 BY FOUR DIFFERENT MODES OF TRANSPORT.
The line graph depicts the number of cargo delivered in the UK by four transportation methods over a 28-year time frame in 1974. Except for the railway, it is apparent that other alternatives all experienced an increase in commodities conveyed.
To begin with, the majority of freight was shipped by road in 1974, with over 70 million tons, while only roughly one-tenth of that amount was reported in terms of pipelines. On-road transportation exhibited steady growth over the timespan, reaching its peak in 2002 with nearly 100 million tons. In addition, freight transshipment through pipelines hit the highest point - nearly 30 million tons in 1990 before slightly dropping back to over 20 million in the next year and remaining constant for the remainder of the era.
In 1974, the amount of cargo transported by waterway and railway was approximately 40 million in 1974. The amount of freight conveyed by water increased constantly except in 1998, reaching more than 60 million at the end of the period. In contrast, it was shown that the utilization of trains for goods transportation fluctuated over time, wavering between 28 to nearly 41 million.

Screenshot2023031.png

