ptthao0801
Jun 1, 2023
Writing Feedback / The graph below shows the average number of UK commuters travelling e train between 1970 and 2030 [2]
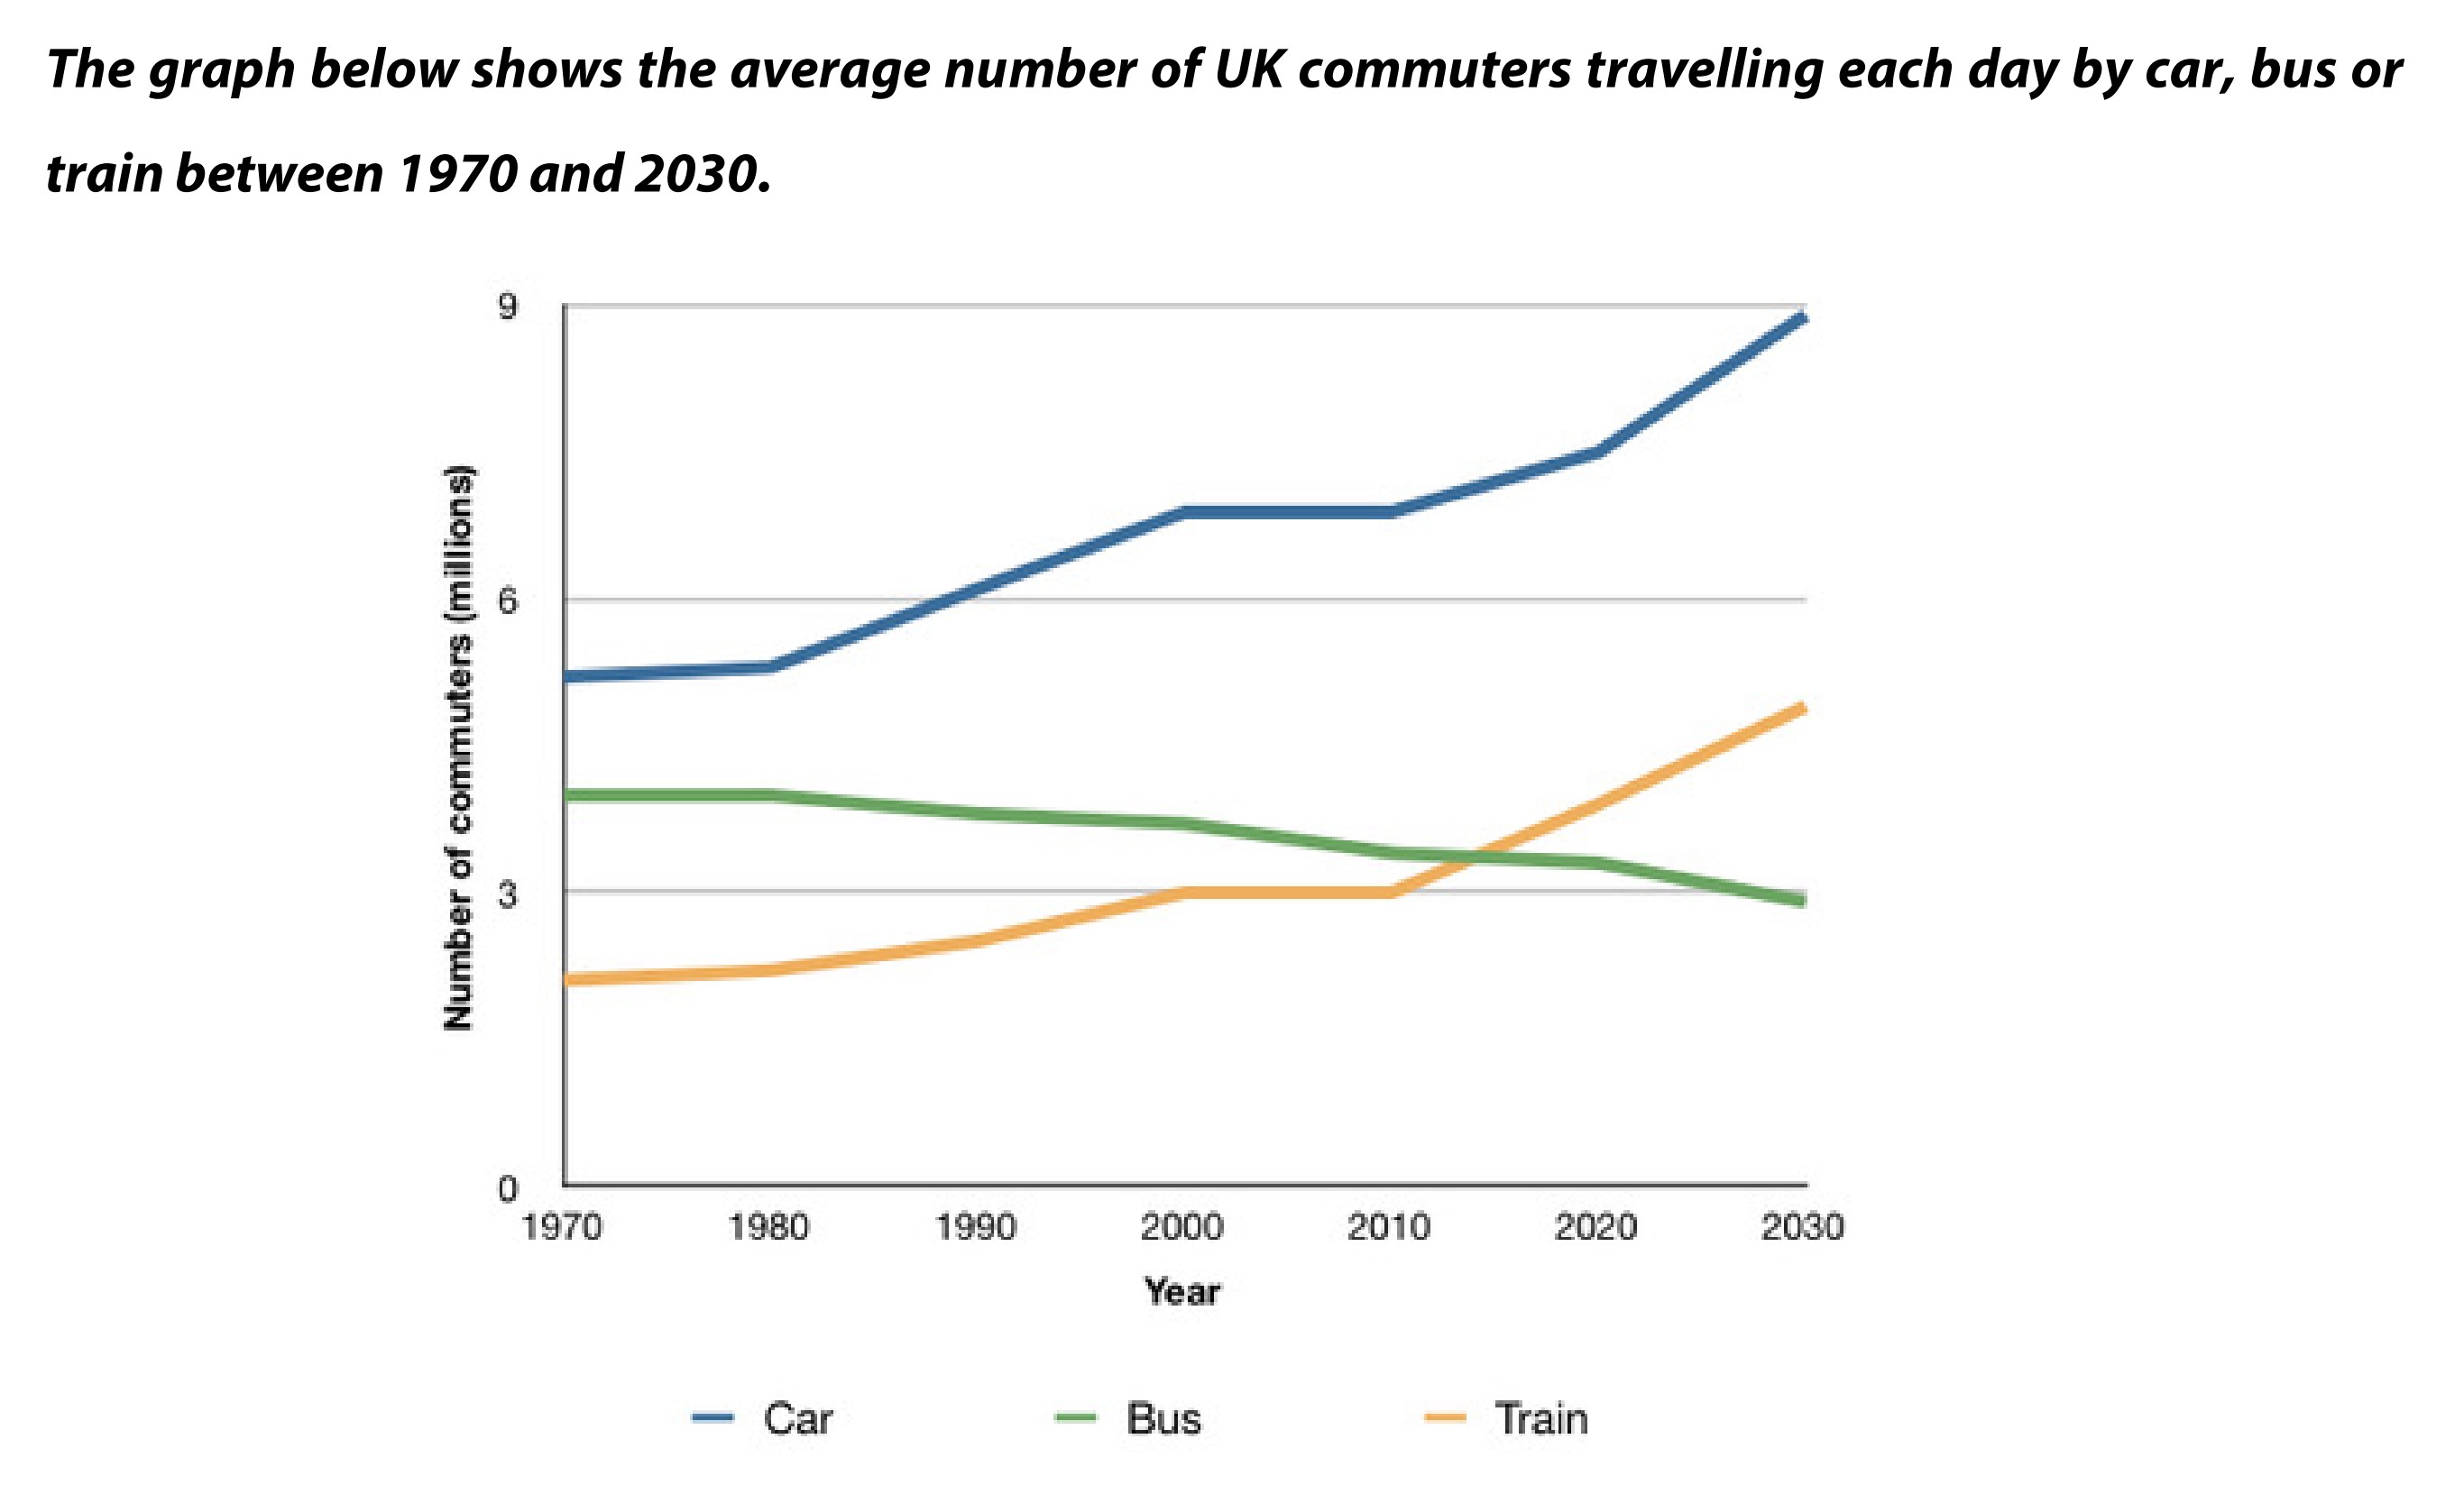
Overall, the numbers of car and train commuters increase gradually over the period shown, meanwhile, bus sees a decline in trend. Cars are seen as the most popular means of transportation.
In 1970, there were over 5 million people who drive in the UK, compared to 4 million people traveling by bus and 2 million rail passengers. The fall in the commute trend of buses and the uptrend in rail travel made an overlap in 2015, at around 3.5 million commuters. In the same year, cars reached over 7 million in the number of its users after a significant rise in 2000.
After 2015, growths in the trends of cars and trains continue and are expected to reach new peaks of 9 million and nearly 5 million, respectively, by the year 2030. In contrast, the number of bus users is predicted to drop to just under 3 million in the same year.
(171 words)
The given graph gives information about daily traveling by vehicle in the UK from 1970 to 2030.
Overall, the numbers of car and train commuters increase gradually over the period shown, meanwhile, bus sees a decline in trend. Cars are seen as the most popular means of transportation.
In 1970, there were over 5 million people who drive in the UK, compared to 4 million people traveling by bus and 2 million rail passengers. The fall in the commute trend of buses and the uptrend in rail travel made an overlap in 2015, at around 3.5 million commuters. In the same year, cars reached over 7 million in the number of its users after a significant rise in 2000.
After 2015, growths in the trends of cars and trains continue and are expected to reach new peaks of 9 million and nearly 5 million, respectively, by the year 2030. In contrast, the number of bus users is predicted to drop to just under 3 million in the same year.
(171 words)

2.jpg


