kamikazexoxo
Jan 8, 2015
Writing Feedback / [IELTS Writing task 1] US consumers' average annual expenditures on cell phone and residential phone [2]
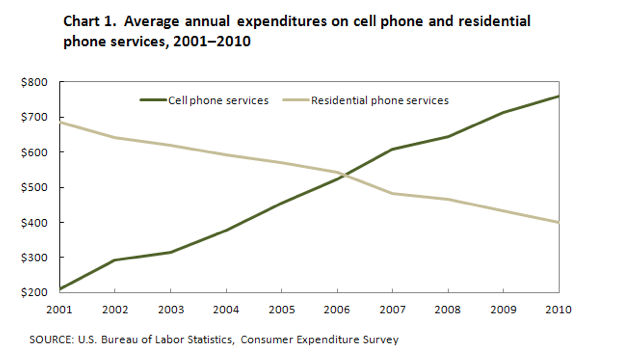
The graph below shows US consumers' average annual expenditures on cell phone and residential phone services between 2001 and 2010.
---
The line graph compares American consumers' average yearly spending on mobile phones and landline phones between 2001 and 2010 .
Overall , it can be seen clearly from the chart that residential phone services witnessed a downward trend from 2001 to 2010 , while cell phone services went up sharply during the same periods . However , In 2006 , there was a same pattern between mobile phones and landline phones .
To begin with , In 2001 , the average spending figure for residential phone services started at the highest point ( approximately $700 ) while that of mobile phones only accounted for $200 . Over the following 5 years , the yearly spending on landline phones saw a dramatical decline , whereas there was a sharp growth in cell phone services . In 2006 , average American expenditure on cell phones and residential phones shared the same figures at around $500 . In the year of 2010 , the expenditure of American on landline phones droped by approximately $300 , from $700 in 2001 to nearly $400 in 2010 ; in contrast the Americans' outlay on cell phone services reached a peak at about $750 , which is about 3 times higher than that in 2001 .
I haven't practiced for a while , i hope you guys can help me to improve my writing :)

ieltswt1.png
