thuylinh
Mar 18, 2014
Writing Feedback / IELTS; Fish and Meat consumption in European country between 1979 and 2004 [5]
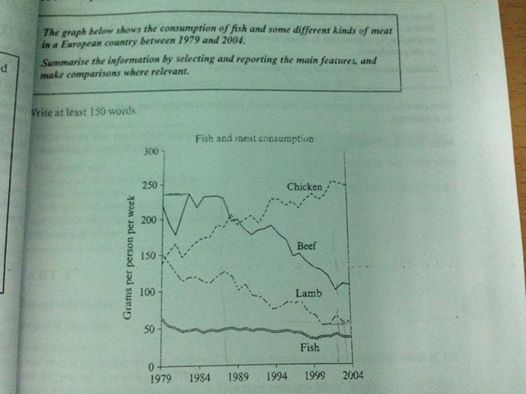
The graph illustrates the different needs for fish and some kinds of meat in a European country between 1979 and 2004.
Generally, the number of units sees a fluctuation with the demand for 3 kinds of meat always higher than that for fish.
To specify, for the first 2 years, after a significant decrease, the consumption of beef witnessed a non-stop rise from 160gr/person/week to a peak of 235gr/person/week before hitting a low of about 100gr/person/week. By comparison, starting with a slight increase, the need for chicken saw a steady climb from about 150gr/person/week up to above 250gr/person/week. Different from the need for beef and chicken, that for lamb felled continuously from 150gr/person/week to only 55gr/person/week. While the consumption of three kinds of meat underwent a continuous fluctuation, that of fish still remained more or less unchanged at quite low number (about 50gr/person/week). Interestingly, a similar downward pattern was recognized in the need for fish, lamb and beef while chicken always increased by about 100gr/person/week.
On the whole, people in this country tend to dramatically reduce the consumption of beef and lamb while increase that of chicken and stabilize that of fish.

1901222_627016890702.jpg

