Unanswered [3] | Urgent [0]
  

Posts by Syahrul08
Name: Syahrul Tuba
Joined: Jan 18, 2016
Last Post: Jan 21, 2016
Threads: 3
Posts: 2  
From: Indonesia
School: Muslem University of Indonesia

Displayed posts: 5
sort: Latest first   Oldest first  | 
Syahrul08   
Jan 21, 2016
Writing Feedback / The pie chart compares the amount of average consumption of family in one country from 1950 to 2010. [2]

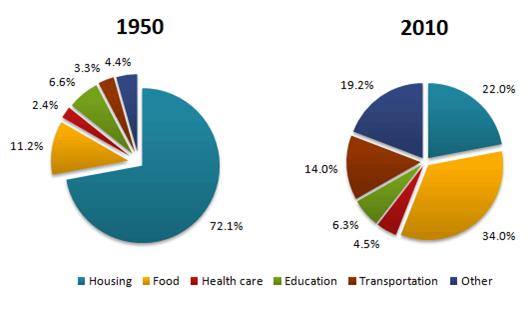
The pie charts below show the average household expenditures in a country in 1950 and 2010

The pie chart compares the amount of average consumption of family in one country from 1950 to 2010 compared by percentage. Overall, it can be seen that the largest change were in the percentage of consumption to the housing and food. All of consumption of family was increase until in the end period.

In 1950, the most favorite expenditure of people was housing, representing stood at 72.1% which was over a half of all consumption, and it was dramatic decrease in 2010 by just 22 per cent. People consumed food at 11.2%, it was the second largest of consumption and increasing more than threefold in 2010 at 34.0 per cent. Initially, average expenditures of people in the country on education, transportation, health care and other were fairly low, at only around just under seven per cent each.

Interestingly, in 2010, people used transportation increase enormously more than around fourth fold, at 14.0 per cent. The household spent of health care and education which were nearly changed not significantly. But consumption of family from other increased considerably from around four per cent to 19.2 per cent.


  • 12573005_10206062801.jpg
Syahrul08   
Jan 20, 2016
Writing Feedback / Consumption of energy by fuel in the USA from 1980 with prediction until 2030. [2]

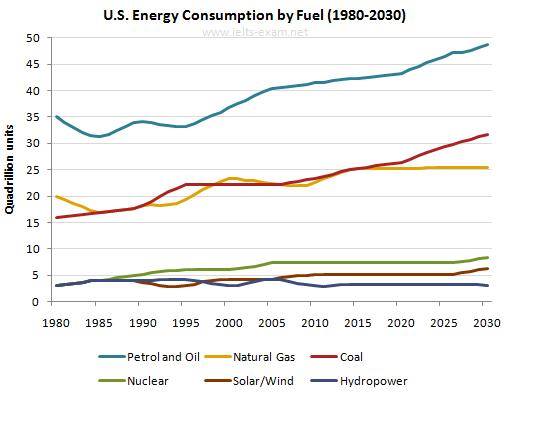
The graph below gives information from Annual Energy Outlook 2008 about consumption of energy in the USA since 1980 with projection until 2030.

The line graph compares six sectors of Annual Energy Outlook 2008 about consumption of fuel in term of the amount of population in the USA that they consumed from 1980 until 2030. Overall, it is can be seen that the total amount of using fuel in the USA increase between 1980 and is predicted 2030. The largest rise is petrol & oil, and coal supply sector.

In 1980, The USA people consumed energy of petrol & oil stood at 35 quadrillion units. The natural gas and coal sectors were 20 and just over 15 quadrillion units respectively, while the nuclear, solar/wind and hydro-power had the same amount of units around fourth quadrillion units.

Consumption from petrol & oil gradual increase, and will reach just under at 50 quadrillion units in 2030. Followed by coal and natural gas increase slightly. In 2015, those had a number of the same units, it was 25 quadrillion units, then coal sector is predicted rise sharply at just over 30 quadrillion elements in the end year, while natural gas is portended remained stable at 25 quadrillion units in 2030. On the other hand, energy consumption by fuel of the USA people from nuclear and solar/wind, are forecast very small growth approximately eight and fourth quadrillion units in 2030. While the hydro-power is predicted constant around three quadrillion units in the end period.


  • line_graph.jpg
Syahrul08   
Jan 18, 2016
Writing Feedback / The percentage of pupils who accomplished their test. [2]

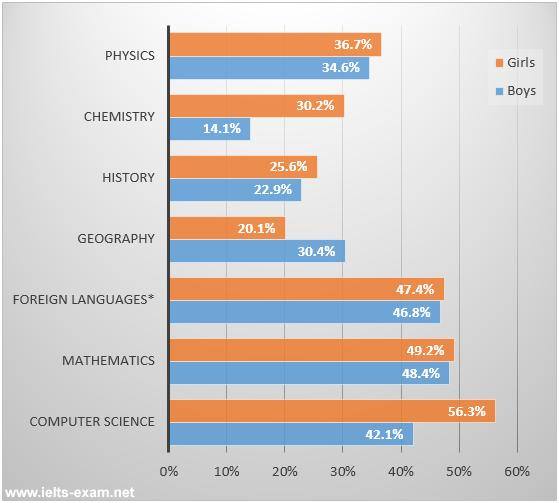
The bar chart below shows the percentage of students who passed their high school competency exams, by subject and gender, during the period 2010-2011.

The bar chart compares the percentage of teenagers who graduated in exam high school by theme and femininity from 2010 to 2011. It is important to note that the percentage of women students who took Computer Science more graduated then teenagers in the six subjects. The men students who were the highest percentage of subject graduation by Mathematics.

Based on the figure, The schoolchild women succeeded in Computer science exam stood at 56.3%, which was the highest figure shown on the chart. In contrast, Geography was the lowest percentage of graduation from women, at only 20.1%. The form for graduating on Mathematics and Foreign Language at nearly 50%. In addition, the percentage of Physics, Chemistry and History who graduated at 30.2% and 25.6% respectively.

Interestingly, the schoolboys who graduated in their test were same percentage, at like a half sent by Mathematics and Foreign Language. Followed by Computer Science, Physics, Geography and History each. The amount graduated by schoolboys on Chemistry, at 14.1 percent, was the lowest figure the shown on the chart.


  • 12540601_10206046579.jpg
Need Writing or Editing Help?
Fill out one of these forms:

Graduate Writing / Editing:
GraduateWriter form ◳

Best Essay Service:
CustomPapers form ◳

Excellence in Editing:
Rose Editing ◳

AI-Paper Rewriting:
Robot Rewrite ◳

Academic AI Writer:
Custom AI Writer ◳