Unanswered [1] | Urgent [0]
  

Posts by Zizou88
Name: ZizouIbrahim
Joined: Apr 22, 2016
Last Post: Apr 23, 2016
Threads: 1
Posts: 1  
From: Indonesia
School: GLT School

Displayed posts: 2
sort: Latest first   Oldest first  | 
Zizou88   
Apr 23, 2016
Writing Feedback / IELTS TASK 1: Electricity Generation in Germany in 3 decades; nuclear rose dramatically [4]

Hi Mochtar, your report is basically excellent as it is well-organised and being able to understand easily. I just have some notices on it :

- "...is depicted in the pie charts ." -- this is because the task has 2 charts.
-"...in 1980, nuclear stood at 20 units...", "...started at 28 and 22 units respectively." I think you should avoid using word like "stood at, started at" in the pie chart case because, from my point of view, these words are generally more appropriate for line graph, in which the time frame described. Instead, you are actually able to say: "In 1980, the number of nuclear generator was only 20 units..."

Well, by the way, do you read some books provided by IELTS Buddy? This is just because your sentences style seems like that kind of books.
Zizou88   
Apr 22, 2016
Writing Feedback / IELTS Task 1 "Percentage of water used for different purposes in six areas of the world" [5]

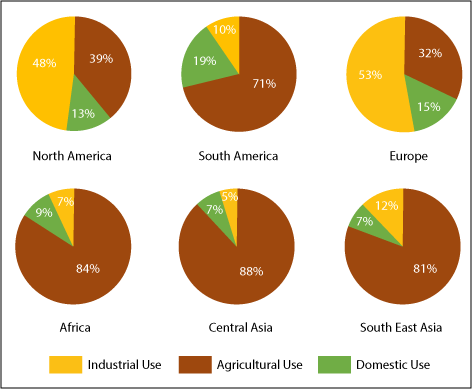
The charts below show the percentage of water used for different purposes in six areas of the world.
Summarise the information by selecting and reporting the main features, and make comparisons where relevant.
You should write at least 150 words.


The pie charts provide information about the proportion of water consumption for three different aims in some parts of the world.

A closer look at the data reveals that industrialization occurred in Europe has resulted in more than half of the water there is consumed for this category. Following this, North America consumes 48% water for its industry, while Central Asia uses only 5%, which is tenfold lower than North America, for the same purpose.

Turning to agricultural uses, the pattern is extremely different with the previous category. Some regions such as Central Asia, Africa, and South East Asia have a fairly similar pattern with water used for agriculture is 88%, 84% and 81% respectively. However, North America and Europe considered less consuming water for this category than other regions with just around one-third of the whole consumption.

Compared to other purposes, domestic usage accounted for a small proportion in all areas. It is interesting to note that Africa, Central Asia, and South East Asia consume water with the same amount (7%) whereas other areas use roughly double of that amount, with South America become the part of the world using the biggest proportion of water for this type of use.

To sum up, it can be seen vividly that the primary water consumption in North America and Europe is for industrial purposes whilst other regions, agriculture dominated water usage.


  • percentageofwater.png
Need Writing or Editing Help?
Fill out one of these forms:

Graduate Writing / Editing:
GraduateWriter form ◳

Best Essay Service:
CustomPapers form ◳

Excellence in Editing:
Rose Editing ◳

AI-Paper Rewriting:
Robot Rewrite ◳

Academic AI Writer:
Custom AI Writer ◳