Irvinhi
Jun 1, 2016
Writing Feedback / IELTS Task 1 (Practice) Estimated percentage of car trips by purpose and gender of drivers, 2005 [6]
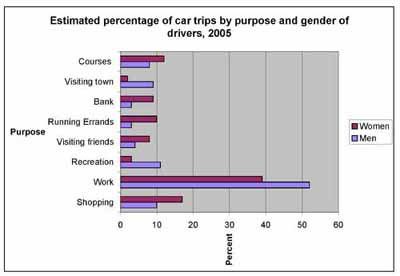
A breakdown of the figure for the number of car trips by purpose and gender of drivers in 2005. As seen in the chart, it is important to notice that "work" broke the record as the highest proportion compared with others. While visiting town hit the low.
The vast proportion comes from work, almost reached Three fifths. This was followed by shopping, one fifth. Recreation was popular one in Man side, approximately 10 percent, while the women side just less than 5 percent. It seems women rarely visiting town, it can be seen that it just about 3 percent, while men was biased, about half one fifth.
A part of previous comparison, the lowest reach was bank and running errands by men, approximately less than 5 percent. Visiting friends almost 5 times as much as work. It obvious that Women prefer to running errands than visit her friends. The different work of men and women look likely just slightly, about 10 percent.
how much the score? thank you.

comparisonchart.jpg
