Unanswered [13] | Urgent [0]
  

Posts by Test_Taker15
Name: Kripke
Joined: Sep 9, 2016
Last Post: Sep 13, 2016
Threads: 4
Posts: 3  
Likes: 2
From: Paper towns

Displayed posts: 7
sort: Latest first   Oldest first  | 
Test_Taker15   
Sep 13, 2016
Writing Feedback / IELTS academic task 1 - Energy consumption & greenhouse gas emission. [4]

Hello, TJ. Thank you for your feedback :)

I noticed a few mistakes that I had made only after I submitted the summary, and I concur with all your suggestions. I don't know whether evaluators would frown upon the usage of brackets, but I don't use them to evade formulating complex sentences. I'll try to use less number of brackets from here on :)

Thank you once again, TJ. Contributors on this forum are awesome and helpful.
Test_Taker15   
Sep 12, 2016
Graduate / I got the privilege to study under some of the country's renowned professors; 'background' essay [3]

Hello, Alok. Welcome to the Essay Forum!

I have a few very minor suggestions for you. Your essay looks good to me.

1. I noticed that you don't use the Oxford comma, and there have been various debates on the same. I like the Oxford comma, and hence I have suggested a few places where it can be used.

2. #4, I think there's a typo there or that you missed a word or something while copy-pasting it.

#1...contribute to a wide variety of projects, and most importantly hone ...

#2... in the All India Engineering Entrance Exam among ten lakh aspirants... using a number others could relate to outside India would sound better, however, this is just my suggestion.

#3 ... Cloud Computing, Cryptography[,] and Software Management to name a few... -- use the Oxford comma to distinguish different subjects.

#4... come up with effective technical solutions and deliver awesome ?? in an environment where ...

#5 ...Indian Society for Technical Education, and a core member..

*I'm not an expert user, please do take my suggestions with a pinch of salt*. Hope this helps you.
Test_Taker15   
Sep 12, 2016
Writing Feedback / IELTS academic task 1 - Energy consumption & greenhouse gas emission. [4]

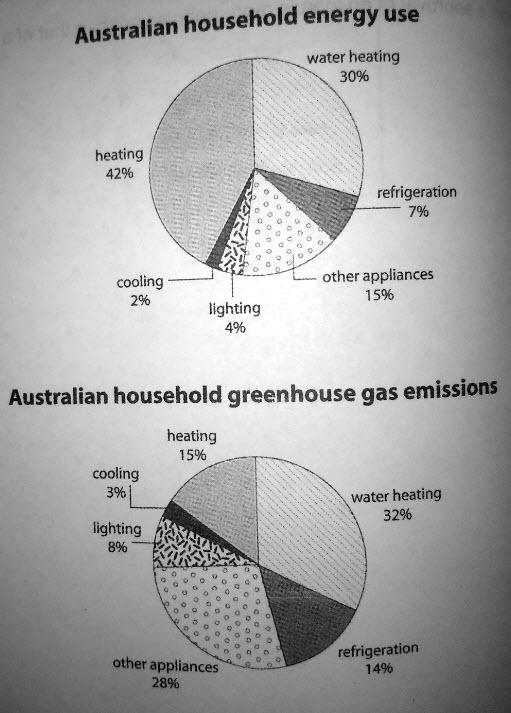
Prompt: The first chart below shows hoe energy is used in an average Australian household. The second chart shows the greenhouse gas emissions which result from this energy use. Summarize the information by selecting and reporting the main features, and make comparisons where relevant.

--------------------------------------------------------------------------------------------------------------------------------------------------------------------------------------
The pie charts illustrate the proportion of energy consumed by various appliances (water heater, heater, cooler, lights, refrigerator, and other appliances), and the greenhouse gases emitted by those appliances in an average Australian household.

Overall, the highest proportion (above 70%) of energy was consumed by heating devices (heater and water heater) and the lowest proportion of energy (6%) was consumed by lighting and cooling devices. Greenhouse gases emitted by water heater and other appliances together accounted for more than half of the total emissions.

In terms of energy used, two third of the total (75%) energy was used for heating purposes, in contrast to cooling and lighting, which only consumed 6% of the energy together. Energy consumed by refrigerator and other appliances were 7% and 15%, respectively.

With regard to greenhouse gas emissions, surprisingly, lights, refrigerators, and other appliances emitted twice the amount of the energy (8%, 14%, and 28%) they consumed. Greenhouse gases emitted by water heaters, heaters, and coolers comprised of other half (50%) of the total emissions.

--------------------------------------------------------------------------------------------------------------------------------------------------------------------------------------

No.of.words = 170.


Test_Taker15   
Sep 12, 2016
Writing Feedback / IELTS academic task 1 - Destination of UK graduate and postgraduate students. [2]

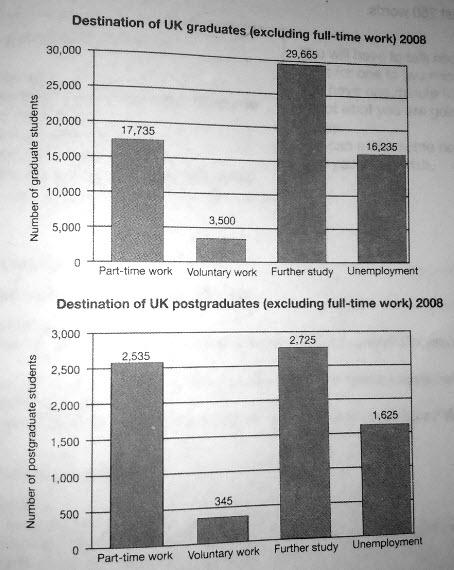
Prompt:The charts below show what the UK graduate and postgraduate students who did not go into full-time work did after leaving college in 2008. Summarize the information by selecting and reporting the main features, and make comparisons where relevant.

The bar charts provide data on what the students (graduate and postgraduate) of the UK, who did not get into full time work did upon graduation in 2008.

Overall, the number of graduate students fell into all four categories (part-time work, voluntary work, preferred to study further, and unemployed) were significantly greater, in contrast to postgraduate students.

The number of graduate students who preferred to study further were ten times higher (around 30,000) than the number of postgraduate students (around 3,000) who preferred to do the same after graduating. Likewise, highest number of students (above 15,000) who ended up doing part-time jobs upon graduation were also graduate students. The number of post graduate students who did part-time jobs was around 2500.

In terms of unemployment, over 16,000 graduate students were unemployed, whereas only one tenth of postgraduate students (around 1600) were unemployed after graduation. Interestingly, volunteering work, on the other hand, was the least preferred stream of work by both the graduate and the postgraduate students.

----------------------------------------------------------------------------------------------------------------------------------------------------------------------------------------------

Number of words = 166.

I have a few questions regarding this task. I'm highly skeptical of my performance as I took more than 30 minutes to come up with an answer, since I found the chart to be too simple to describe. I kept rewriting the answer in order to meet the task requirements.

1. Is it just me or is it true that the chart is too simple?

2. I've read from various websites that one must not include their opinion while writing task 1, how true is that?

3. Is there another way to answer this task? If so, could you please tell me how?

----------------------------------------------------------------------------------------------------------------------------------------------------------------------------------------------


Test_Taker15   
Sep 10, 2016
Writing Feedback / Summary: Forget shopping. Soon you'll download your new clothes [2]

Hi, Eka. I've paraphrased a few sentences and made some grammatical corrections wherever possible. I hope this helps you.

Danit Peleg is a designer forof three-dimensional clothes. She was inspired to make the ... She, therefore, designed a skirt and ...When she was invited to an event, she didn't have special/new clothes to wear, and that inspired her to design a three dimensional skirt using a 3D printer, overnight.Then she stitched it in ... Danit admitted that it was not her ...She then stitched it in the next day morning. Danit admitted that it was not her first time printing clothes because she had printed them when she was in design school.

In nine months, she has finished her five clothes designsprinted over five designs, and she made all of them all from home.
Hence, Danit has begun to work individuallywith a big machine and experimented ...with a machine of her own, and she's been experimenting a lot with new materials .

According to Dea nit's talks , everybody can design ...
Thus,in the coming years , people can print the 3-D ...
Test_Taker15   
Sep 9, 2016
Writing Feedback / Statistics of coffee and bananas consumption some years ago in Eurrope [2]

The tables provide sales data of Fairtrade labelled coffee and bananas in five European countries (UK, Switzerland, Denmark, Belgium, and Sweden) in 1999 and 2004. The units are measured in Euros.

Overall, coffee sales had increased in all five countries, but the same was not true for bananas as sales had decreased in two countries (Sweden and Denmark) in 2004 when compared to other countries.

In terms of coffee, Switzerland, which sold coffee worth €3 mil, in 1999 was the top marketer. Sweden, on the other hand, whose coffee sales were at € 0.3 mil in 1999 and € 1 mil in 2004, remained at the bottom of the table in both the years. In 2004, Switzerland's coffee sales doubled (€ 6 mil), while the UK's had significantly increased manifold (€ 20 mil) when compared to 1999. In the same year, only a marginal increase in coffee sales were observed in Denmark and Belgium.

With regard to bananas, Switzerland was the top marketer, which sold bananas for € 15 mil and € 47 mil in 1999 and 2004, respectively. While sales in the UK and Belgium increased in 2004, it had decreased in Sweden (€ 1 mil) and Denmark (€ 0.9 mil) when compared to 1999.
Test_Taker15   
Sep 9, 2016
Writing Feedback / Underground railway system along with inception, kilometers covered and passengers traveled per year [2]

IELTS academic task 1 - underground railway systems of six cities

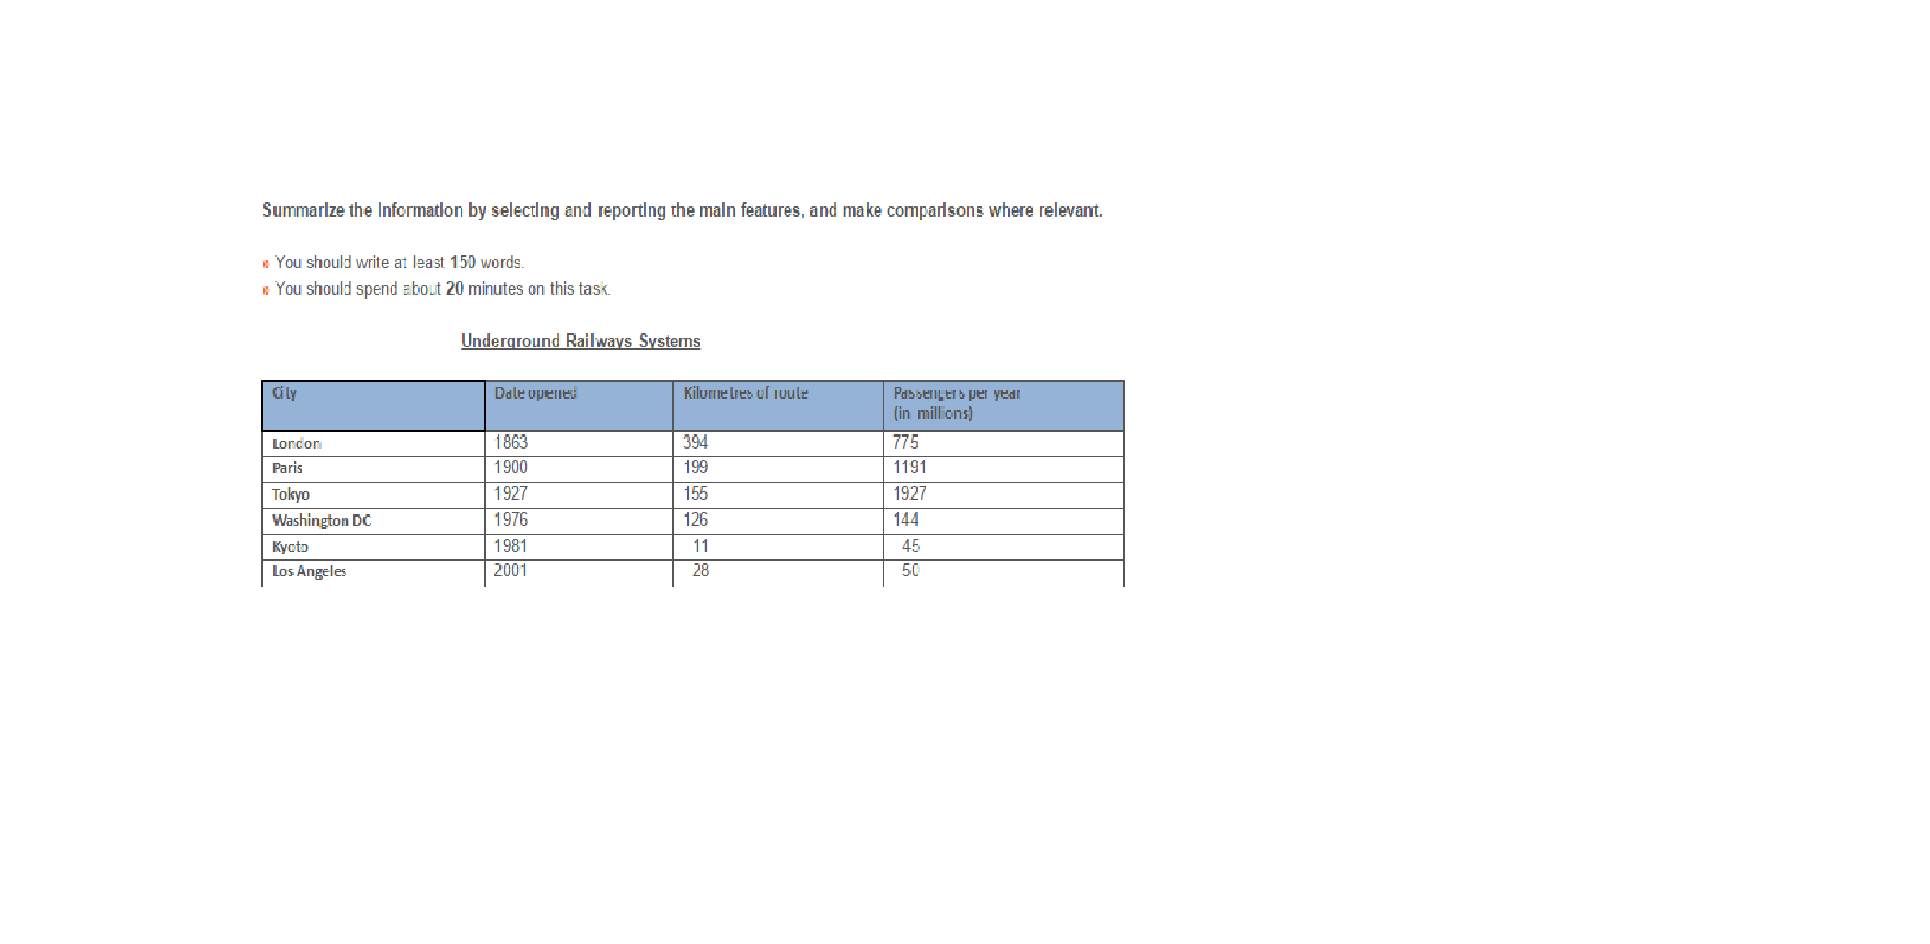
The table provides data on underground railway systems of six cities (London, Paris, Tokyo, Washington DC, Kyoto, and Los Angeles) along with their inception, kilometers covered, and passengers traveled per year.

The London underground railway system is the oldest network which was opened in 1863 compared to the latest Los Angeles underground railway system which was opened in 2001. The underground railway system of Paris, Tokyo, Washington DC, and Kyoto were opened in 1900, 1927, 1976, and 1981 respectively.

In terms of the distance covered, the London underground railways covers the longest distance (394 km) while the Kyoto underground railways covers the shortest distance (11 km). The distance covered the underground railway systems of Paris, Tokyo, Washington DC, and Los Angeles are 199 km, 155 km, 126 km, and 28 km respectively.

Overall, the Tokyo underground railway system carries most number of passengers (1927 mil) per year compared to Kyoto which carries the least number of passengers (45 mil) per year. The Paris underground railway system which covers a distance of 199 km, carries the second most number of passengers per year (1191 mil).The underground railways system of Washington DC carries 144 million passengers per year. The oldest London underground railway system carries 775 million passengers per year, in contrast to the Los Angeles network that carries only 50 million passengers per year.


Writing
Editing Help?
Fill in one of the forms below to get professional help with your assignments:

Graduate Writing / Editing:
GraduateWriter form ◳

Best Essay Service:
CustomPapers form ◳

Excellence in Editing:
Rose Editing ◳

AI-Paper Rewriting:
Robot Rewrite ◳