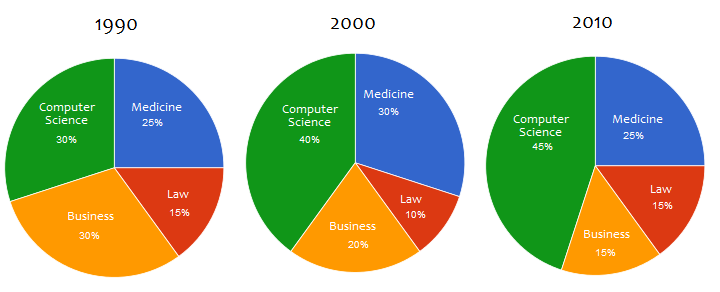
The charts below show degrees granted in different fields at the National University in the years 1990, 2000 and 2010.
The given pie charts depict data on the changes in the number of degrees granted in 4 different fields of study (Law, Medicine, Business and Computer Science) at the National University in 1990, 2000 and 2010.
Overall, it is clear that initially most degrees were granted in Computer Science and Business, whereas Law accounted for the lowest number of awarded degrees. Subsequently, Computer Science remained the most preferred field, as opposed to Business, which decreased in popularity. Law continued showing the lowest figure in 2000 and 2010.
According to the pie charts, in 1990 30% of the degrees were awarded in Computer Science, and following that the figure increased to 40% and 45% in 2000 and 2010 respectively. Conversely, the number of degrees awarded in Business showed a downward trend: the figure was at 30% in 1990, it decreased by 10% in 2000 and there was a 5% decline in 2010.
With regard to the remaining fields of study, 25% of the degrees were granted to Medical students in both 1990 and 2010, while in the same years 15% were awarded to Law students. In 2000 the figure for degrees granted in Medicine rose by 5% and the one for degrees awarded in Law dropped by 5%.

the pie charts
