You should spend about 20 minutes on this task.
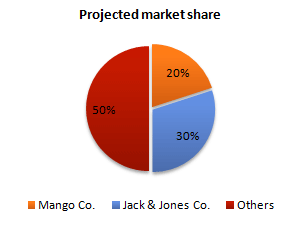
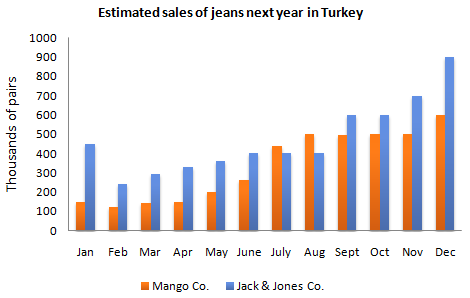
The bar chart below shows the estimated sales of jeans for two companies next year in Turkey. The pie chart shows the projected market share of the two companies in jeans at the end of next year.
Write a short report for a university lecturer describing the information shown below.
Write at least 150 words.
The bar chart predicts the estimated sales of jeans of two companies Mango and Jack & Jones in thousands of pairs for the next year. The pie chart depicts the projected market share of each company at end of next year.
According to the bar graph, the sales of company Jack and Jones will always be more than company Mango , except in months of July and August. The sales of mango company will rise steadily till month of August reaching 500,000 pairs and then stabilize in months of September, October and November . Finally,the sales will increase to 600,000 pairs in month of December.The sales of company Jack and Jones will fluctuate around 400,000 pairs till August and then rise steadily till month of December reaching to a mark of 900,000 pairs. Further, both the companies have their maximum sales in month of December.
The pie chart depicts that half of the market share will be divided among these two companies at the end of the year , 30 % with Jack & Jones and 20 % with Mango.
Thus , to conclude , it can be said that the bar graph and pie chart co relate with each other showing more sales and thus more projected market share for company Jack & Jones.

IELTS_Writing_Task_1.png
IELTS_Writing_Task_1.png
