This Is My Essay For IELTS Writing Task 1. Help Me Revise It. Thank You?
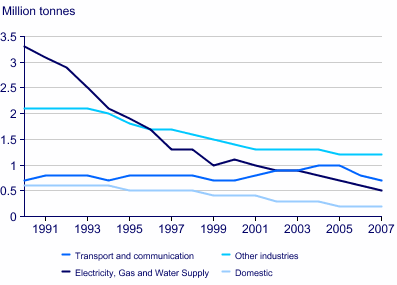
The graph below shows UK acid rain emissions, measured in millions of tones, from four different sectors between 1990 and 2007.
The line graph gives information about the amount of tones of the acid rain emissions from four various fields in the UK over a period of 17 years, starting from 1990.
It is clear that the most noticeable trend with regard the acid rain emissions in all the sectors was decreased and only the transport and communication sector remained unchanged over the period shown in which the domestic sector always stood at lower level than other ones.
In 1990, the highest point of the acid rain emissions in the chart came from the electricity, gas and water supply, which was 3.3 million tonnes. At the same time, the other industries and domestic figure were 2.1 million tonnes and 0.6 million respectively. Afterward, this three sectors were all gone down whereas the electricity, gas and water supply sector was the most sharp decrease, at 0.5 million tonnes which was lower 2.5 times than other industries but was twice as much as that of domestic in 2007.
As the data suggested, around 0.7 million tonnes of acid rain emission came from the transport and communication in 1990. Following this, this sector experienced a relatively low fluctuation and back again to its original level in 2007.
UK acid rain emissions
The graph below shows UK acid rain emissions, measured in millions of tones, from four different sectors between 1990 and 2007.
The line graph gives information about the amount of tones of the acid rain emissions from four various fields in the UK over a period of 17 years, starting from 1990.
It is clear that the most noticeable trend with regard the acid rain emissions in all the sectors was decreased and only the transport and communication sector remained unchanged over the period shown in which the domestic sector always stood at lower level than other ones.
In 1990, the highest point of the acid rain emissions in the chart came from the electricity, gas and water supply, which was 3.3 million tonnes. At the same time, the other industries and domestic figure were 2.1 million tonnes and 0.6 million respectively. Afterward, this three sectors were all gone down whereas the electricity, gas and water supply sector was the most sharp decrease, at 0.5 million tonnes which was lower 2.5 times than other industries but was twice as much as that of domestic in 2007.
As the data suggested, around 0.7 million tonnes of acid rain emission came from the transport and communication in 1990. Following this, this sector experienced a relatively low fluctuation and back again to its original level in 2007.

acidrain.png
