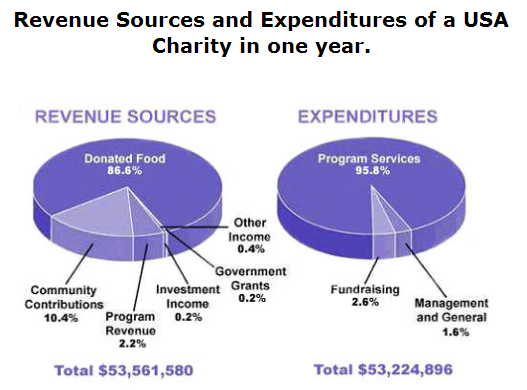
The pie chart has presented activity of charity in United State for one year. The chart is divided to become two pies, comparing between revenue sources and expenditures. Over all, it can be revealed that while donated food is the greatest income resources, almost all of sources are used to program services. Moreover, there is rest of total budget that is not spent for activities.
During one year, a very large majority of revenue comes from donated food at 86.6%. Then, the second inflow is occupied by community contributions at only 10.4% whereas program revenue becomes big three of revenue resources, at 2.2%. Finally, other resources are gained from investment, government grants, and other income, that these all are less than 0.5%.
Meanwhile, the USA allocates the donations for three major activities. Program services are the most popular activity for charity in this year, representing more than four-fifth at 95.8%. It is solely less than 3% for other sectors, 2.6% (fundraising) and 1.6% (management and general). Interestingly, total of expenditures is only $53,224,896 from total of revenue $53,561,580. Therefore, there is rest of charity total revenue at $336,684.
(189 words)

ES7.png
