Unanswered [4] | Urgent [0]
  

Home / Writing Feedback   % width   Posts: 15


IELTS Task 1 : Adult educational survey report


SHanafi 120 / 357  
Apr 1, 2014   #1
Hellloow Friends...
I wrote this task in 20 minutes, please kindly corrected mine, thank you
================================================
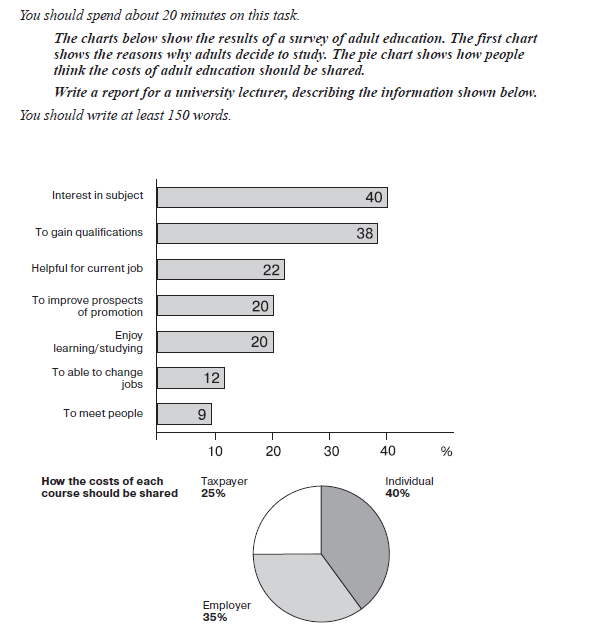
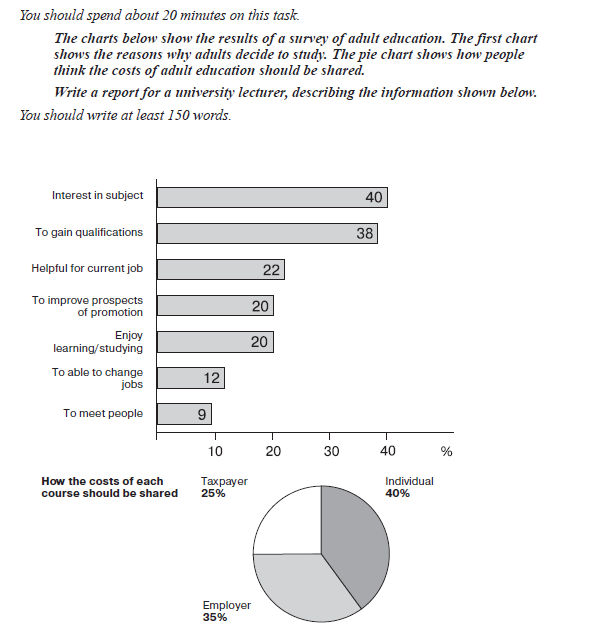
The charts depict a report of an educational survey in terms of why they study and whether the share of educational fee should be shared.

Overall, the majority of adults tend to study due to their interest in subject while two fifth adult think that educational course fee should be shared individually.

Turning to the details, adult think that 25 percent of educational fee should be shared by the taxpayer. However, other 35 percent of educational fee is the responsible of employer.

Move onto the pie chart, there is the highest percentage by 40 percent adult study aims due to their subject's interest, while the following aim to gain qualification by 22 percent adult. However, purposing in ability to change job come 12 percent, and is followed by the least 9 percent adult study to meet people.

Interestingly, while the bar chart shows the variety percentage, the resemblance percentage by 20 percent adults either enjoying study process or due to improve prospects of promotion is occurred.

  • Cambridge_1_writing..jpg


eddies [Contributor] 25 / 1170  
Apr 1, 2014   #2
Hello.. I am sure no one can't even see the picture in details. It is too small, dear :D

either enjoying study process or due to improve

Faulty parallelism
Please visit this link to see the possible suggestion: grammartips.homestead.com/parallelism1.html

adult think

two fifth adult think

I feel the word 'Think' sounds too clumsy here

Moveing onto

responsible of

responsible for
MisterWandering 18 / 314  
Apr 1, 2014   #3
The charts depict a report of an educational survey in terms of why they study and whether the share of educational fee should be shared.

The bar chart provides information about the reasons for studying of adults and the pie chart illustrates how tuition fees should be shared among individuals, employers and taxpayers.

Overall, the majority of adults tend to study due to their interest in subject while two fifth adult think that educational course fee should be shared individually.

You don't need to give data in the overview paragraph. You had better save it for your next paragraph, where you just mention the percentages of the other two subjects.

Overall, the majority of adults tend to study due to their interest in subject while individuals should be responsible for the highest proportion of educational fees.

Move onto the pie bar chart

I find this phrase kinda redundant.

Turning to the details

,

Move onto the pie chart

,

Interestingly

You could omit all these phrases.

Interestingly, while the bar chart shows the variety percentage, the resemblance percentage by 20 percent adults either enjoying study process or due to improve prospects of promotion is occurred.

You don't have to have a separate paragraph about this feature. It should be placed in your previous paragraph so that you could compare with other proportions.
OP SHanafi 120 / 357  
Apr 1, 2014   #4
I am sure no one can't even see the picture in details. It is too small, dear :D

Hellow, eddies :DDDDDD
Here the bigger one.


  • cambrigde_1_test_1.p.png
OP SHanafi 120 / 357  
Apr 2, 2014   #5
Helllowww, MisterWandering

SHanafi:
Turning to the details
,
SHanafi:
Move onto the pie chart
,
SHanafi:
Interestingly
You could omit all these phrases.

I am very glad when you come to correct my writing. It means that i will get better sentence and appropriate vocabularies. Thank you for always scrutinize my careless :D

In my previous, you also suggest me to avoid the similar phrases. I have a confusion why it should be omitted while as far as my ability those phrases help me to guide reader in which part I want to mention ?

would you kindly give me explanations ? :D
dumi 1 / 6793  
Apr 2, 2014   #6
First, your diagram is too small and it is not at all readable for a blind person like me :D

The charts depictpresent the findingsa report of an educational survey in terms of why theydo students study and whether the share ofhow does the educational fee should beis shared.
MisterWandering 18 / 314  
Apr 2, 2014   #7
would you kindly give me explanations ?

Hi, Sekar! I told you this because I'm afraid that these phrases do not add much value to your paragraph. I think you could start your body paragraph directly with the features of the chart you are going to describe. For example, in your first body, you could say: Individuals are thought to share the highest proportion of education fees with 40%.

I hope this helps!
OP SHanafi 120 / 357  
Apr 7, 2014   #8
Hi, Sekar! I told you this because I'm afraid that these phrases do not add much value to your paragraph. I think you could start your body paragraph directly with the features of the chart you are going to describe.

.. I see, MisterWandering
I should be sharped my observation to the trend to make better coherence and cohesion without using invaluable phrase, thank you...w1
eddies [Contributor] 25 / 1170  
Apr 8, 2014   #9
Move onto the pie chart, there is the highest percentage by 40 percent adult study aims due to their subject's interest, while the following aim to gain qualification by 22 percent adult. However, purposing in ability to change job come 12 percent, and is followed by the least 9 percent adult study to meet people.

Let me give a few edits:
A subject's preference breaks a record as the highest percentage. Gaining qualification, this shows 22 percent of participants. However, there seems a slight gap between the opportunity for changing the job and meeting people, with twelve and 9 percent of participants.
OP SHanafi 120 / 357  
Apr 8, 2014   #10
Heloooow eddies :DD

A subject's preference breaks a record as the highest percentage. Gaining qualification, this shows 22 percent of participants. However, there seems a slight gap between the opportunity for changing the job and meeting people, with twelve and 9 percent of participants.

I have confused about consistency in writing.While i see in your sample,the usage of number and word, can conclude it is permitted in writing, and there is not part of inconsistency ?. Then, what kind of inconsistency itself? Have you a link for me to read ?

Hellow, Dumi

in terms of why they study

why I said "they", this is vague.I have yet mentioned the reference of "they" before :(((((

n terms of whythey do students study

... thank you for this

your diagram is too small and it is not at all readable for a blind person like me :D

My apology, dumi. I often make troubles when uploading picture T.T
eddies [Contributor] 25 / 1170  
Apr 9, 2014   #11
I have confused about consistency in writing.

I think we have not discuss this area yet.

Then, what kind of inconsistency itself?

What you have explained is good, but hard for me to understand. Please say it in a simple way.
OP SHanafi 120 / 357  
Apr 12, 2014   #12
I think we have not discuss this area yet.

:(( I, see.

Please say it in a simple way

Let me try to explain, eddies. I saw your editing

with twelve and 9 percent of participants

... I have curious why you write number in different ways, "9" and"twelve". In my mind, it looks like inconsistent. So, I asked you. Is that good when we write such way in IELTS and is it not categorized as inconsistency ? If there is not, what is inconsistency itself ?.

Actually, I really proud that you are willing to give me some sources that I can read.
Hopefully this quite understand to you. Thank you..
eddies [Contributor] 25 / 1170  
Apr 14, 2014   #13
is it not categorized as inconsistency ?

what is inconsistency itself ?.

The answer sadly says "I dunno what the inconsistency is." I never ever read and heard about that.

I really proud that you are willing to give me some sources that I can read.

Go get Google :D
OP SHanafi 120 / 357  
Apr 25, 2014   #14
Here I wrote this essay as my ability under 20 minutes. unfortunately, I made similar mistakes that some of you already remind be above. But, I do nothing to edit my hand writing converse to this typing, as the honesty of my ability :D

The bar chart illustrates the number of students in study purpose and the pie chart gives information about the groups who take responsibility of educational payment.

Overall, the majority of adult decides to study based on the subject interested, while the cost of study should be taken as individual responsibility.

As per chart information, 40 adults do study alongside their interest of subject. While the gain qualification purpose coming second record by 38 learner chosen, 22 learner argue that learning is very helpful for their current job. 20 adult made up study for prospecting promotion and enjoying study resembly, whereas the least 9 adult interest to meet people and slight higher 12 people do study to change their job.

A closer to the pie chart, the study course should be shared individually by 40 % respondent reckon in the statistic, this is a 5 % higher than that of the 35% answer through the educational fee which should be paid by the employer. However, taxpayer stance as the least percentage under review, by 25 % adult think their educational contribution for adult education.


  • cambrigde_1_test_1.p.png
dumi 1 / 6793  
Apr 30, 2014   #15
Move onto the pie chart, there is the highest percentage by 40 percent adult study aims due to their subject's interest, while the following aim to gain qualification by 22 percent adult. However, purposing in ability to change job come 12 percent, and is followed by the least 9 percent adult study to meet people.

The pie chart reveals that the cost of subject had been borne by 40% of the cost of higher education had been borne by individuals while 35% of the total cost had been borne by the employer. .... Also tell something about the bar chart too :)


Home / Writing Feedback / IELTS Task 1 : Adult educational survey report
ⓘ Need Writing or Editing Help?
Fill out one of these forms:

Graduate Writing / Editing:
GraduateWriter form ◳

Best Essay Service:
CustomPapers form ◳

Excellence in Editing:
Rose Editing ◳

AI-Paper Rewriting:
Robot Rewrite ◳