IELTS-Cambridge 8- test 1_writing task1
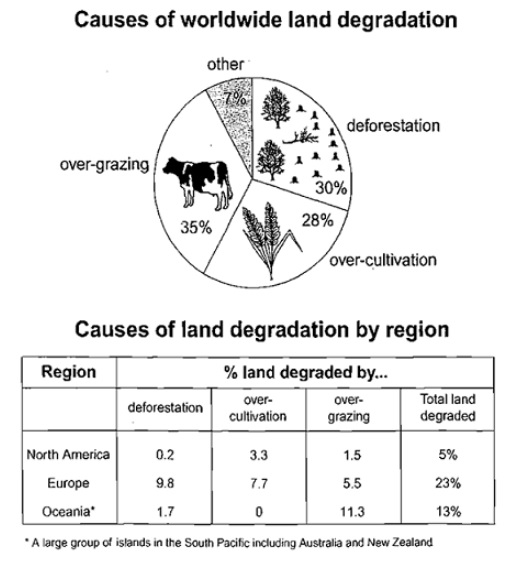
The pie chart below shows the main reasons why agricultural land becomes less productive. The table shows how these causes affected three regions of the world during the 1990s.
Summarize the information by selecting and reporting the main features, and make comparisons where relevant.
Given are two figures reveal the reasons of infertile farmlands in different regions. The first one is a pie chart, which provides the proportion of each reason, including over-forestation, over-cultivation and over-grazing. Another figure is table, which provides the percentage of three reasons in three regions, namely, North America, Europe and Oceania. Overall, one particularly interesting fact highlight by figures is that cattle factory is the fatal cause for degradation.
The cattle industry stands 35% in the worldwide farmland, while the timber industry stands 30%. In addition, the agriculture industry densely cultivates the crops and vegetations, it stands 28% in the global. The deforestation, over-cultivation and over-grazing are the main reason lead to the global farmlands less productive, other reasons stand merely 7%.
It is noteworthy that the infertile land in Europe is more than other two regions. The proportion of three of the main reason in deforestation, over-cultivation and over-grazing is 9.8%, 7.7% and 5.5%, respectively. In general, Europe gains 23% infertile land in global statistics. In stark contrast, North America only gains 5% infertile land, 0.2% in deforestation, 3.3% in over-cultivation and 1.5% in over-grazing. It is obvious that the proportion of over-cultivation is 0% in Oceania. Oceania's agriculture is not the importance of their living, instead their cattle industry and timber industry support their living. The proportion of deforestation and over-grazing gain 1.7% and 11.3% in the total 13%.
The pie chart below shows the main reasons why agricultural land becomes less productive. The table shows how these causes affected three regions of the world during the 1990s.
Summarize the information by selecting and reporting the main features, and make comparisons where relevant.
reasons of infertile farmlands in different regions
Given are two figures reveal the reasons of infertile farmlands in different regions. The first one is a pie chart, which provides the proportion of each reason, including over-forestation, over-cultivation and over-grazing. Another figure is table, which provides the percentage of three reasons in three regions, namely, North America, Europe and Oceania. Overall, one particularly interesting fact highlight by figures is that cattle factory is the fatal cause for degradation.
The cattle industry stands 35% in the worldwide farmland, while the timber industry stands 30%. In addition, the agriculture industry densely cultivates the crops and vegetations, it stands 28% in the global. The deforestation, over-cultivation and over-grazing are the main reason lead to the global farmlands less productive, other reasons stand merely 7%.
It is noteworthy that the infertile land in Europe is more than other two regions. The proportion of three of the main reason in deforestation, over-cultivation and over-grazing is 9.8%, 7.7% and 5.5%, respectively. In general, Europe gains 23% infertile land in global statistics. In stark contrast, North America only gains 5% infertile land, 0.2% in deforestation, 3.3% in over-cultivation and 1.5% in over-grazing. It is obvious that the proportion of over-cultivation is 0% in Oceania. Oceania's agriculture is not the importance of their living, instead their cattle industry and timber industry support their living. The proportion of deforestation and over-grazing gain 1.7% and 11.3% in the total 13%.

Cambridge_TEST8test.jpg
