fruit production comparison
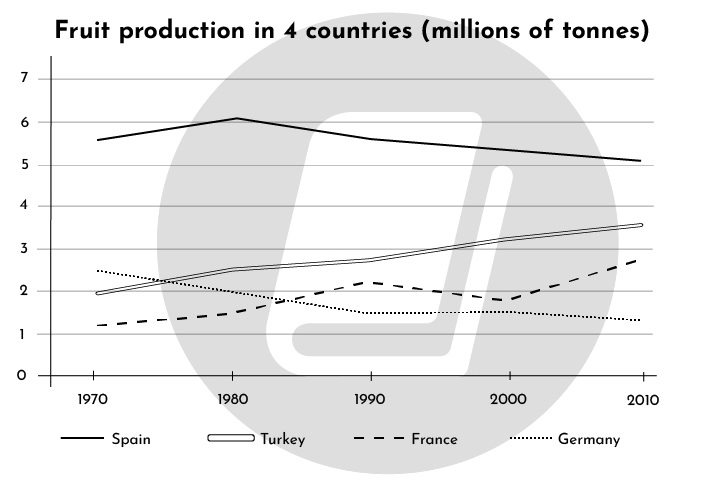
The line graph illustrates the production of fruit in four nations: France, Spain, Germany, and Turkey between 1970 and 2010.
It could be seen that the amount of fruit produced in Spain and Germany observed a down string trend while the reverse could be seen in that of others countries. Additionally, Turkey took the initiative in producing fruit throughout the period.
In particular, starting at approximately 5.5 million tonnes in 1970, fruit production in Spain rose marginally to a staggering 6 million tonnes in the next ten years before dropping gradually and hit the bottom at 5 million tonnes in 2010. Besides, Germany produced merely 2.5 million tonnes of fruit in the first year of the period; thereafter this figure decreased moderately by 1 million tonnes in 1990 and then stayed static until the end of the course, marking the lowest rate of the chart.
At the beginning of the course given, the corresponding figure in Turkey and France were in the vicinity of 2 and 1 million tonnes, respectively. Subsequently, the former registered a relative constant rise to 3.5 million tonnes over a 40-year period, surpassing the fruit manufactors of Germany. Meanwhile, the latter increased slightly by 1 million tonnes in 1990, after which it continued rising to hit the top at nearly 3 million tonnes at the course end despite an insignificant rise between 1990 and 2000.

n.jpg
