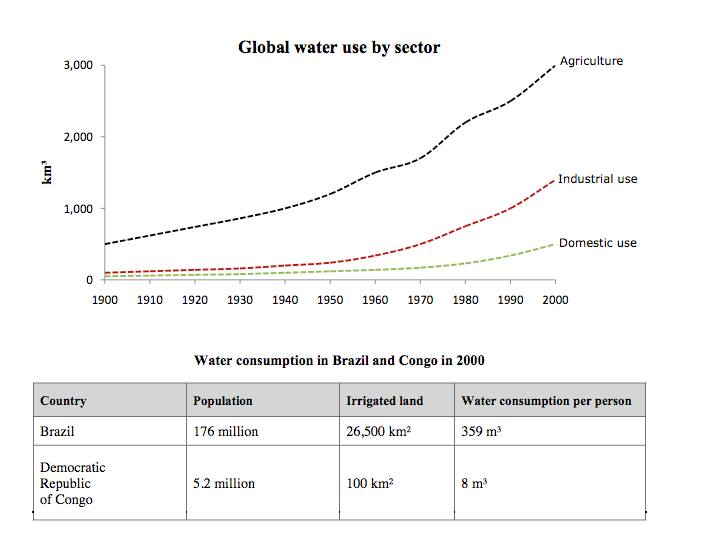
The line graph compares the amount of global water consumption based on three different sectors from 1900 to 2000, while the table shows the using of water in Brazil and Congo in 2000. Overall it can be clearly seen that the using of global water showed an increasing trend in every sector. On the other hand , Brazil had the higher amount of water consumption in all variable than Congo.
In the beginning period, Industrial sectors almost had the same amount of consuming water as domestic need about 100 km3, while 500 km3 was used by agriculture. Around the period, the water consumption of three sectors gradually grew even higher, when domestic need consumed the least water at 400 km3 and industrial field used about 1000 km3 in 2000. At the same time, agriculture successfully broke a record as the highest sector which consumed water about 3000 km3.
In Brazil, the number of population was about 33 times higher than Congo in 2000 at 176 and 5,2 million of people respectively. Congo's people consumed 8 m3 where it was less than brazilian at 359 m3. In addition to, 26,500 m2 land in Brazil could be irigated by water and only 100 km2 in Congo.

Global_water_use_glo.jpg
