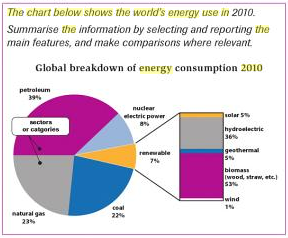
The chart below shows the world's energy use in 2010.
The chart gives information regarding the energy use and parts of renewable energy in 2010 and is measured in percentage. In general, it can be seen from the chart that petroleum was the most energy that people used and there were various energy sources within renewable energy.
In detail, the petroleum energy was the primary source of power in the world. About 39% of this energy had been used by people. Then, people consumed 23 percent of natural gas and 22 percent of coal power. It means that in 2010 these three main energy became world's energy supplies.
Following this trend, the percentage of nuclear and renewable power use had more or less the same level. Eight-percent of the world's energy comes from nuclear source, it was 1% higher than the proportion of renewable energy. Within the renewable sector, there are different sources of energy. Biomass and hydroelectric were dominant in this sector at 53 percent and 36 percent respectively, whereas the percentage of wind energy use was the smallest figure at 1 %. In addition, both solar and geothermal had been used at 5 percent by people in 2010.

pie_chart_page_93.PN.png
