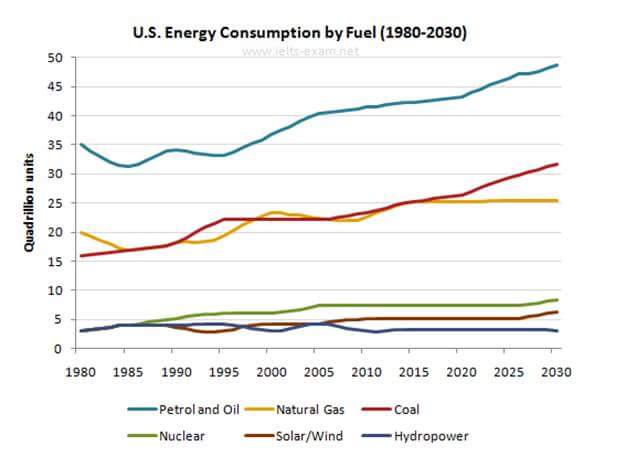
A breakdown of annual energy usage in the USA measured in Quadrillon units from 1980 to 2030, as the projected year, a half-century period is presented in the line chart. Overall, it can be seen that there is an upward trend in the amount of energy utilization of petrol and oil. In any case, natural gas and coal energy show similar pattern.
Moving to a more detailed analysis, in 1980, petrol and oil stood at 35 Quadrillon while coal energy was 5 Quadrillon less than natural gas at 15 and 20 respectively. In the next following years, there was a fluctuate in the amount of petrol and oil consumptionand was expected to still become a popular choice in 2030 which reached approximately 48 Quadrillon. Similarly, coal and natural gas experienced up and down of proportion although the coal was forecasted to exceed the natural gas energy by 5 Quadrillon.
Turning to the other three resources, nuclear, hydropower, and solar/wind started at the same point about 4 Quadrillon. Afterwards, there was a gradual rise of fuel consumption and was projected to stay virtually the same in the last 20 year. A closer look at the chart reveals that there is an ascending trend for petrol and oil, natural gas and coal energy, while nuclear, solar/wind and hydropower show a steady trend.

FB_IMG_1454509160310.jpg
