amour /
May 4, 2016 #1
Hi friends, it would be great if you give me some suggestions and assess how much the score of IELTS that will i get by this essay, thanks in advance :)
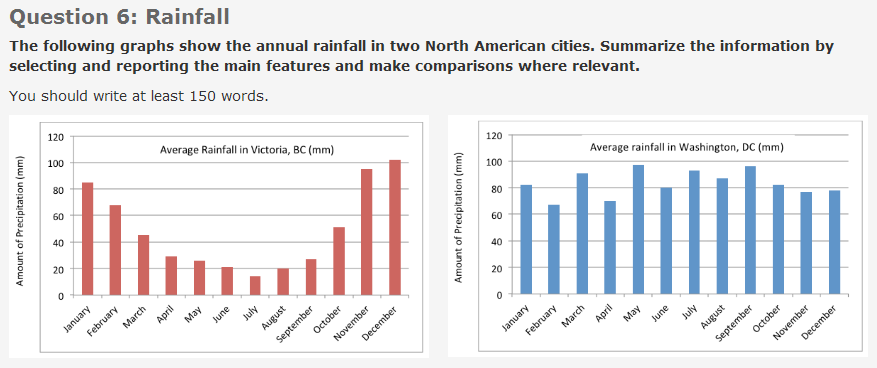
The annual rainfall in Victoria and Washington is depicted in the bar graphs. Overall, it is noticeable that Washington has average rainfall higher than Victoria throughout the months.
In Victoria, it is revealed that from January to July, the average rainfall decrease gradually, wherein the least amount of precipitation is in July at approximately 15 mm. Thereafter, the trend shows increase respectively from June to December, in which the latter year is the highest amount of precipitation. It is in November and December at roughly 100-105 mm.
On the other hand, Washington has lofty amount of precipitation in all of the months. It is above 65 mm over the year in comparison to Victoria that predominantly under of it. Washington has the highest average rainfall in May at virtually a hundred mm, while the least is in February at approximately seventy mm. Furthermore, from October to January, the figure is stable, with the amount of precipitation at around 78-81 mm.

Firefox_Screenshot_2.png
