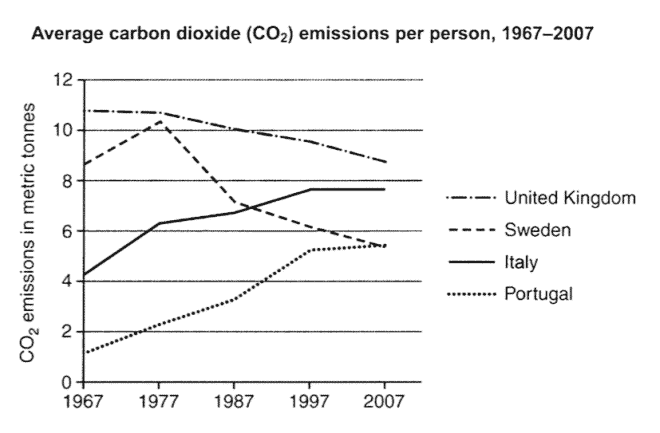
The average carbon dioxide (CO2) emissions per person in four countries
The graph below shows the average carbon dioxide (CO2) emissions per person in the United Kingdom, Sweden, Italy and Portugal between 1967 and 2007.
Summarise the information by selecting and reporting the main features, and make comparisons where relevant.
The line graph illustrates the average amount of carbon dioxide emitted each individual in 4 Europe countries over the 40-year period.
In general, although the median emissions of carbon dioxide for all four regions showed some fluctuation from year to year, we could identify some clearly upward and downward trends.
In 1967, about 4 metric tonnes of carbon dioxide were produced by a Italian citizen. This figure rose steadily until 1997 to reach approximately 8 metric tonnes and then levelled off. Sharing the same trends with Italy, the proportion of Portugal went up noticeably 4 metric tonnes, from the starting point at 1 to 5 metric tonnes in the end of the period.
By contrast, the carbon dioxide emissions for the other two countries decreased by varying degrees. There was a gradual fall in the rate of carbon dioxide in United Kingdom during the given period. This proportion began with the highest number at 11 metric tonnes, kept decreasing and finally peaked 9 metric tonnes in 2007. The most fluctuated moving was the carbon dioxide production in Sweden. There was a sharp growth from 8 to 11 metric tonnes over 10 years, but then declined dramatically until 2007 and reached the similar level as Portugal at 5 metric tonnes.

pastedimage0.png
