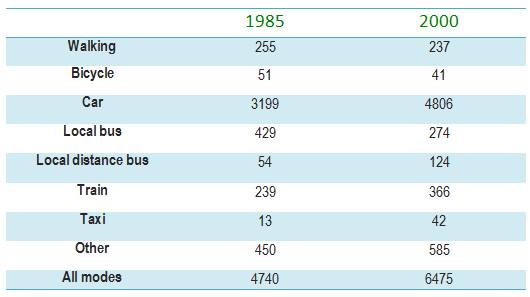
A breakdown of the inhabitants' average distance of the transportation modes in England between 1985 and 2000 is depicted by using a table that is measured in miles. Overall, car was presented as the highest value, while the lowest was taxi. In general, it can be divided into three categories, there are vehicles that had tremendous, moderate, and tiny changes.
To begin with, the most enormous change was shown by taxi that rose more than three times than before, from 13 to 42. Then, private car, which had the foremost number went up to more than 50%, from 3199 to 4806. It was followed by train and local distance bus, both had around similar raise.
The second division were local bus and other which had distinct trend, although their change was moderate. While the local coach deteriorated moderately by 155 in 2000, other kinds of transportation mode went upward from 450 to 585.
Lastly, it was represented by walking and bicycle. It can be seen that pedestrian only had different 18 miles in those two years, while less distance was shown by cycler that solely at 51 in 1985, and had the tiniest drop among all by 10 miles.

15327590_10202233035.png
