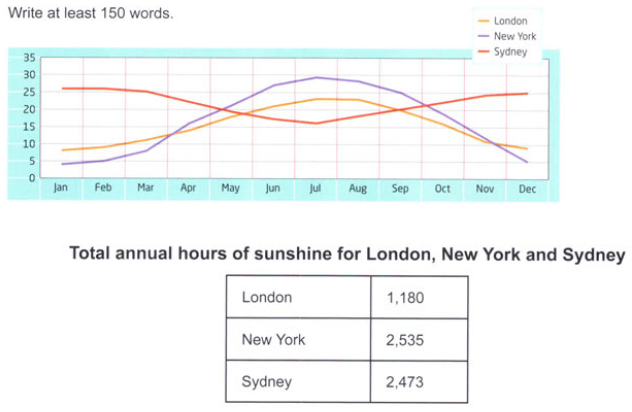
The line chart illustrates about the average monthly temperature and the table shows the annual hours of sunlight for three different countries, London, New York and Sydney. Overall, It can be seen that New York is the hottest country compare to Sydney and London, whereas London has a little number of annual hours of sunshine.
To begin with, in the first month Sydney has a high temperature at just above 25°, and during period the temperature declines and reaches the lowest point in July at approximate 15°. The sunlight involves the area at 2.473 hours/year. Followed by Sydney is New York that stand at low point at just under 5° and upward to the highest level with 30° in July. New York gets sunshine 2.535 hours/year that is the biggest among the counties. The third county is London that at the beginning of the year records starting at approximately 9°, and the sunlight is shining 1.180 hours/year that is the lowest of temperature.
However, on the middle of year, the temperature in Sydney rises and has gradual rebound in middle of November at around 25° same as in January. In contrast, both of New York and Sydney are ongoing to the lowest point in the end of year at just under 10°, and 5° is the lowest temperature in New York.

welly.png
