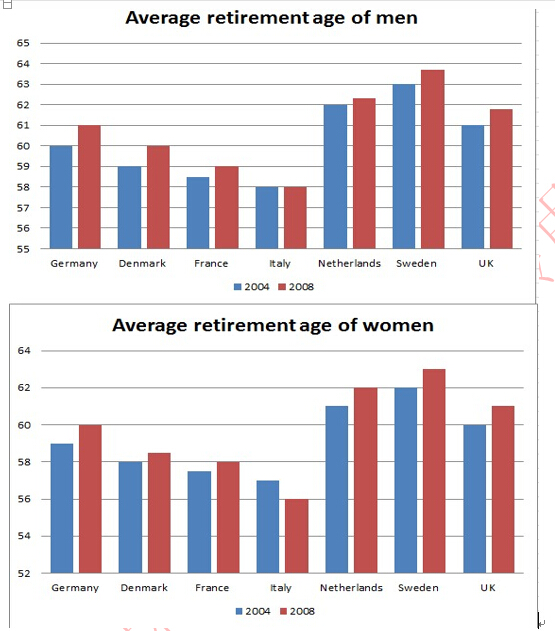
The two bar charts show a series of figures about average retirement ages of men and women among seven countries in 2004 and 2008.
There was an upward trend that the average retirement ages of people in all countries in 2008 were higher than the figures in 2008, except Italy. The highest average retirement age of men was in Sweden, rising from 63 in 2004 to 63.7 in 2008. In contrast, Italy had the lowest figures, at only 58 in both years. Netherland, Sweden and UK had longer average retirement ages of men, above 61, while these figures were below 61 in the other four countries.
Women had a similar trend of change in average retirement ages, compared with men. Six countries saw an increase of these figures within the four years, Italy experienced a fall to 56 in 2008, 1 year lower than that in 2004. Sweden till had largest average retirement ages of women, at 62 in 2004 and 63 in 2008.
Overall, it is obvious that women had shorter average retirement ages than men in all countries, where people retired later over the four years.

bar.jpg
