The table below show the figures for imprisonments in five countries between 1930 and 1980.
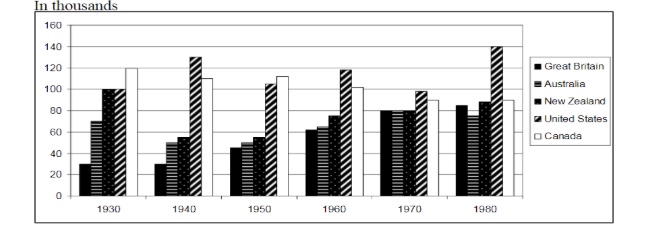
The bar chart delineates the number of imprisonments in five different countries from 1930 to 1980.
A glance at the graph reveals that during the fifty years the highest figures were held by the United States and Canada, with the United states dominating all the years, except for 1930.
Particularly, the number of prisoners in the United States started from 100,000 in 1930 and after several fluctuations reached at 140,000 in 1980, the highest figure in all years and in all countries. On the other hand, Canada witnessed 20,000 more imprisonments than the USA had in 1930 but followed a downward trend and stood at approximately 90,000. Simultaneously, New Zealand began from the same level of imprisonments as the United States, although in 1940, dropped dramatically to only 58,000 prisoners and the next forty years saw an upward trend reaching at just above 90,000. Similarly, Australia followed the same pattern as New Zealand but in 1930 the prisoners were at about 70,000 and by the end of the fifty-year period, with some fluctuations in the meantime, it increased to just under 80,000. Interestingly, Great Britain had the lowest figures of imprisonments, although it saw a steady rise.
Write a report for a university lecturer describing the information shown below.
The bar chart delineates the number of imprisonments in five different countries from 1930 to 1980.
A glance at the graph reveals that during the fifty years the highest figures were held by the United States and Canada, with the United states dominating all the years, except for 1930.
Particularly, the number of prisoners in the United States started from 100,000 in 1930 and after several fluctuations reached at 140,000 in 1980, the highest figure in all years and in all countries. On the other hand, Canada witnessed 20,000 more imprisonments than the USA had in 1930 but followed a downward trend and stood at approximately 90,000. Simultaneously, New Zealand began from the same level of imprisonments as the United States, although in 1940, dropped dramatically to only 58,000 prisoners and the next forty years saw an upward trend reaching at just above 90,000. Similarly, Australia followed the same pattern as New Zealand but in 1930 the prisoners were at about 70,000 and by the end of the fifty-year period, with some fluctuations in the meantime, it increased to just under 80,000. Interestingly, Great Britain had the lowest figures of imprisonments, although it saw a steady rise.

A7341D83A80647549.jpeg
