Unanswered [1] | Urgent [0]
  

Home / Writing Feedback   % width   Posts: 2


The bar chart illustrates the proportion of overweight men and women in Australia


myronpage 1 / -  
Jun 22, 2019   #1

the statistic data about obesity in australia


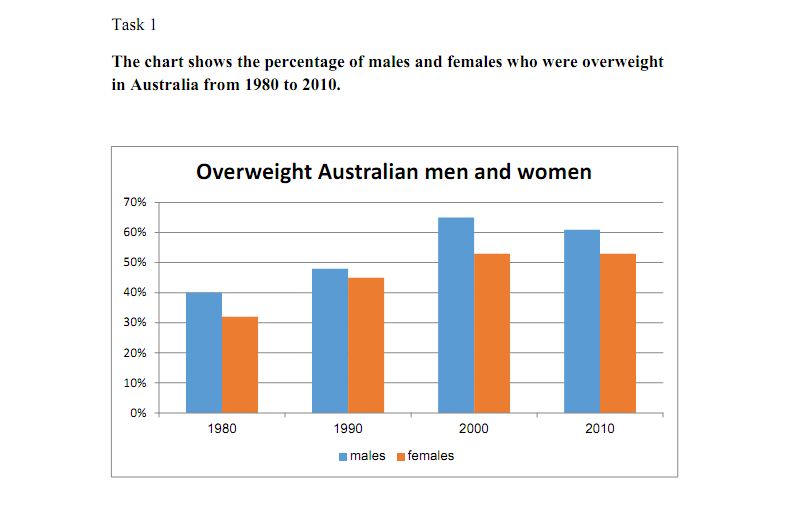
The bar chart below illustrates the porpotion of overweight men and women in Australia from 1980 to 2010.
Overall, it is clear that the percentage of males who were overweight was higher than the female's counterpart, while the figures for both sexes rose over the time period.

In 1980, 40% of Australian men was overweight and this figure increased to 48% in 1990. Although the figure reached the peak of 64% in 2000, there was a slight decrease from 64% to just over 60% in 2010.

In contrast, the porpotion of overweight Australian women was lower than that porpotion of Australian in 1980, started with 31% of the women population in 1980. However, there was a considerable rise in 1990, from 31% to 45%. After that there was a further increase to 52% in 2000, which was over half of the Australian women population, then finally the percentage remained stable in 2010.

  • Task11.JPG


Maria - / 1096  
Jun 23, 2019   #2
@myronpage
Hi there!

Welcome to the forum. I'll provide you with feedback on your writing.

Firstly, I suggest articulating your sentences in a clearer and more concise manner. Try not to stretch your sentences when it's unnecessary and doesn't contribute to the overall substance or meaning that you're trying to relay. Doing this will help you be more cautious of the words that you're putting into your sentences. Remember that a simple straightforward approach can be as effective as complex structures, especially if you're working with data or chart interpretation.

For instance, take a look at this revision:

... overweight; and this figure ... Although the figure it reached the peak ...

Trying to omit as many filler words as you can help will help you curate more interesting and put-together information.

Best of luck as always!


Home / Writing Feedback / The bar chart illustrates the proportion of overweight men and women in Australia
Do You Need
Academic Writing
or Editing Help?
Need professional help with your assignments? Fill out one of these forms:

Graduate Writing / Editing:
GraduateWriter form ◳

Best Essay Service:
CustomPapers form ◳

Excellence in Editing:
Rose Editing ◳

AI-Paper Rewriting:
Robot Rewrite ◳