I will apreciate every kind of recommendation in order to improve my writing skills.
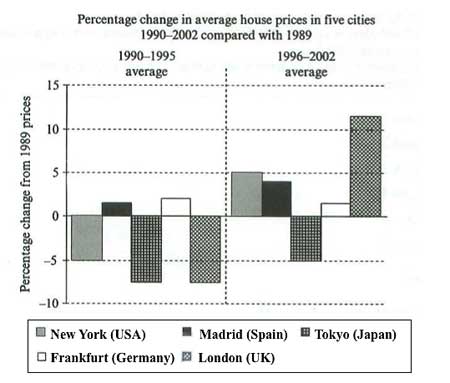
The bar chart provides information about the changes in average house prices in five major cities during the period between 1990 and 2007 compared with the average price of the houses in 1989.
It is clear to see that, the most signifficant went downs in the period betweeen 1990 and 1995 were experienced in Tokyo and London. The both saw a diminish in prices by approximately 8 %., which was considerably higher than the decrease in New York, which was of about 5%. On the other hand, both Madrid and Frankfurt house prices were an object of slight increases, as went ups of respectevely 2% and 3 % have been observed during the given period.
During the followin period, the prices in London have exceeded by more than 10 %. New York's and Madrid's prices were also an objects of increases, but even though they were not as big as in London, the prices there went up by about 5% compared to the rates from 1989. A small increase took place in Frankfurt, but the only actual decrease was observed in Tokyo, where the prices diminished by 5%.
At the end of the day, in the period between 1990 and 1995 a few decreases were observed, in combine with a couple of minor went ups, whereas during the second period the prevalent trend was of increasings, with only one went down obrseved throught out the period.

averagehouseprices.jpg
