Unanswered [2] | Urgent [0]
  

Home / Writing Feedback   % width   Posts: 2


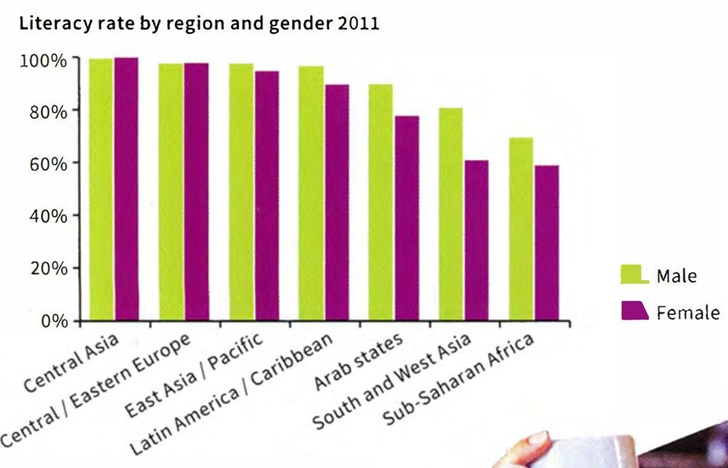
The bar chart shows the literacy rate (% of people who can read and write) in 2011 by regions


htlam11 1 / -  
Oct 14, 2023   #1

literacy rate by region and gender


The bar chart illustrates the proportion of male and female literacy rate in 7 different regions .
Overall, a cursory glance at the bar chart below is sufficient to make it vivid that the proportion of literate male and female in 7 different regions in 2011. It is obvious that the Central Asia and Eastern Europe have the highest rate of literate men and women. On the other hand, the Sub-Saharan's citizen has the lowest ability to read and write.

As can be seen from the chart, the central Asia zone led the way with the percentage of literate female and male by maximumly 99% and 100% respectively. The zone in second place is Central/Eastern Europe, in which male's ability to read and write is 1% lower than female's ability.

The greatest difference, which was about 20%, between the 64 per cent literate female and male belonged to South and West Asia. The following regions, which is Sub-Saharan Africa with a percentage of around 65%, additionally, the female is 12% less than the males.

  • 401.728.0_rspx8xt8t4.jpg


Holt  Educational Consultant - / 15347  
Oct 14, 2023   #2
cursory glance at the bar chart below

Never ask the reader to look at the image. You have to narrate the information, not ask the reader to refer to it. The assumption is that the reader does not have any access to the picture that your report is based upon. So you should never mention the location of the image on the page. That is not allowed. It is a violation and you will lose points for doing that.

As can be seen from the chart

This appears to be a repeated violation. You will receive deductions for every reference that you make in the essay. Avoid doing this int he future. You do not want to fail the essay simply because of technical deductions. Be conscious of this going forward.


Home / Writing Feedback / The bar chart shows the literacy rate (% of people who can read and write) in 2011 by regions
Do You Need
Academic Writing
or Editing Help?
Need professional help with your assignments? Fill out one of these forms:

Graduate Writing / Editing:
GraduateWriter form ◳

Best Essay Service:
CustomPapers form ◳

Excellence in Editing:
Rose Editing ◳

AI-Paper Rewriting:
Robot Rewrite ◳