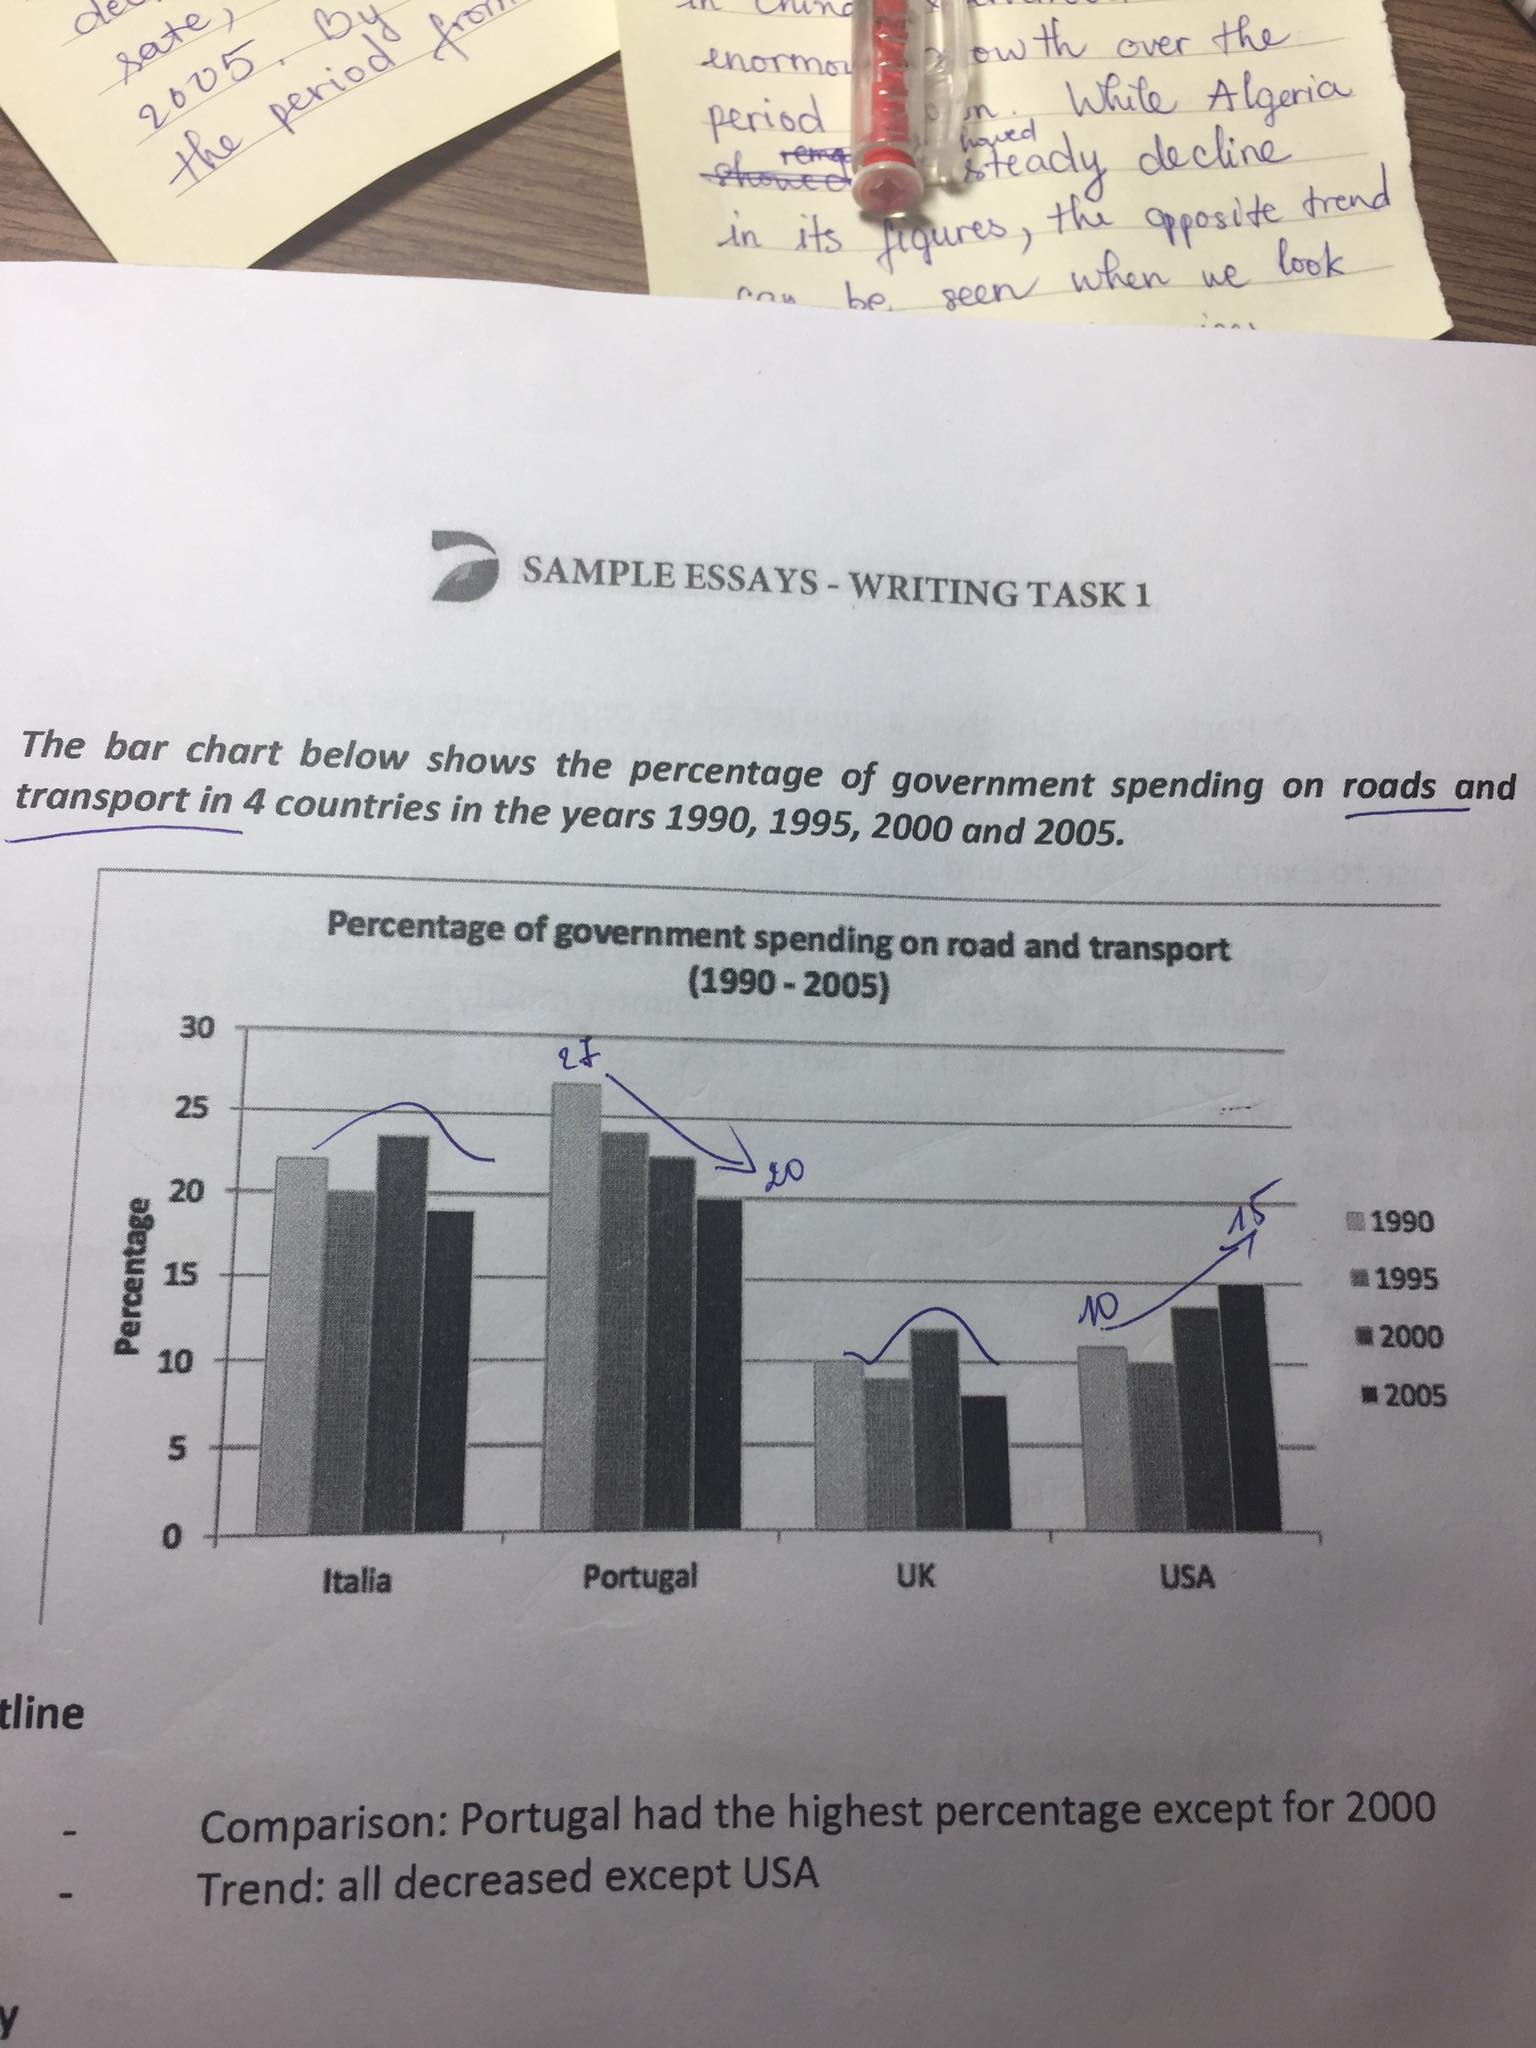
how much money some countries spent on their roads
The bar chart compares four different nations, namely Italia, Portugal, UK and USA in terms of how much money those countries spent on their roads and transport over the course of 15 years starting in 1990.
Overall, Portugal had the highest percentage of spending on this area. In addition, all countries showed a decline in their figures with the exception of the USA.
As can be seen from the chart, in 2005 Portugal accounted for the highest growth percentage with over 25%, which is about three times higher than that of UK. However, during the following years, this country witnessed a decrease in its growth rate, down to 20% in 2005. By contrast, over the period from 1990 to 2005, USA began with slightly above 10%, this proportion then rose to exactly 15% at the end.
In comparison, between 1990 and 2000, Italia's figure climbed quickly and reach a peak of nearly 24% before dropping rapidly to 19% in the last year. Similarly, a similar trend was also observed in the UK, whose statistics decreased from 10% to 8% during this period but then peaked at 12% in 1995.

bar chart
