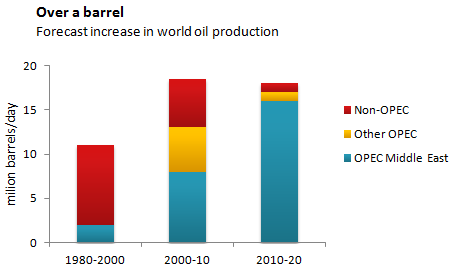
Given is a graph illustrating past, present, and future data about the production of world's oil on OPEC and non - OPEC countries.
It is evident from the information supplied that the amount of oil production in the OPEC Middle Eastern countries is predicted to increase considerably. In stark contrast, oil production in else where is likely to fall.
Between 1980 and 2000, most of world 's oil came from non-OPEC nations with approximately 10 million barrels per day, while only two million units were produced by OPEC countries. Since then, the figures changed considerably, between 2000 and 2010, the number of oil barrel in the OPEC Middle Eastern countries climbed rapidly from 2 million to almost 8 million per day, a rise of about 6 million barrels. Likewise, the oil production in the other countries in OPEC rose dramatically with almost 6 million barrels per day and the rest is provided by non-OPEC countries.
It is worth to notice that forecasters predict that oil production in the world will be stable between 2010 and 2020; a lot more of this oil is expected to come from the Middle Eastern OPEC countries, and only under 5 million barrels per day from the other areas.
P/s: Thanks you for reading my essay in advance.

IELTS_Writing_Task_1.png
