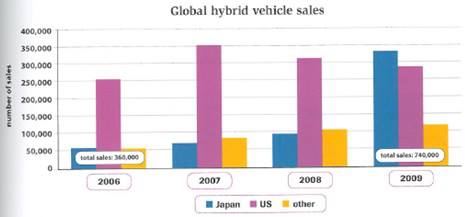
The bar chart below gives information on the global sale of hybrid vehicles between 2006 and 2009.
Summarise the information by selecting and reporting the main features, and make comparisons where relevant.
ESSAY:
The bar graph elucidates the rate of worldwide commerce of hybrid transports during a 3-year period, from 2006 to 2009, in Japan, US, and other countries.
It is noticeable that all hybrid transport sales over the period increased through distinctive patterns among the considered countries. In other words, more customers bought those hybrid technology in the end of the period.
To begin, Japanese buyers inclined sharply from only more than 50,000 in 2006 to above 325,000 in 2009. Similar to this figure, other regions which were also taken into account experienced an upward trend though the increasing number of markets was not as dramatic as a rise in Japan.
On the other hand, the quantity of consumers in United States, who were engaged on purchasing types of transport that are capable to work technologically in hybrid, fluctuated along in the chart's period. The trend began at 250,000 in 2006 and then reached 275,000 in 2009.

ielts_writing_task_1.jpg
