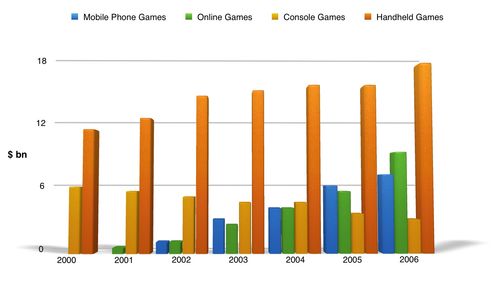
The bar graph shows the global sales (in billions of dollars) of different types of digital games from 2000 and 2006.
A breakdown of the number of selling globally in the different types of digital games between 2000 and 2006, a 3 - year period was presented in the bar chart and is measured in billions of dollars. Overall, the highest sales of games were the handled games. In any case, while the selling of online, console and handheld games rose significantly over the time frame, the mobile phone games witnessed a reverse.
In 2000, standing approximately at 11 billion, the handled games was the most popular games, and this was followed by the console games at 6 million. During the following year, while games witnessed a dramatic rise to 17 billion, the games used console declined gradually, a half of the first year sales and became the lowest popular in over the question period.
Interestingly, the online games emerged in 2001 and contributed around 0.5 billion. In the next a year, this increased slightly by 0.5 billion and had the same figure as online games around at 1 billion. Both of them, then, grew slightly over the following period and the online games turned the second popular games followed by mobile phone in the third position.

The_bar_graph_shows_.jpg
