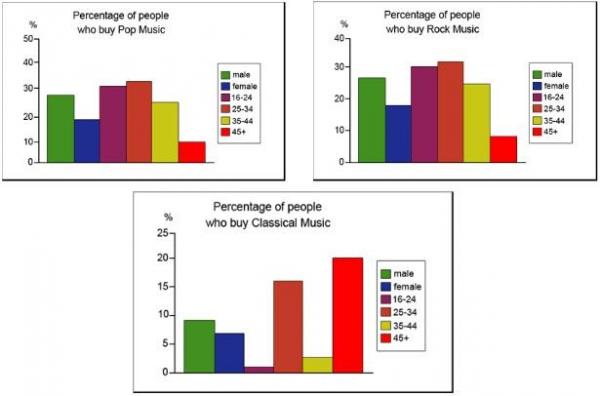
The graph below shows the type of music albums purchased by people in Britain according to sex and age.
The bar graphs give an overview about the percentages of British customers divided into sexes and ranges of age who pour their money on 3 different sorts of music albums. It can be clearly seen from the illustrations that pop and rock music are thoroughly trendy among male, 16 - 24, 25 - 34 and 35 - 44 users while classical one is preferred by 25 - 34 and 45+ purchasers.
According to the first 2 graphs, pop music and rock music share many similarities. Listeners ranging around 25 - 34 years old and 45+ years old made up the highest and lowest percentages respectively in both graphs. However, the figures for rock slightly overcome pop's ones.
Much as customers above 45 seem to pay little or those mentioned products, they bare the most striking characteristic in terms of classical music's sales. These people accounted or up to a fifth of the final graph, which means the budget they spend on this kind double that on the others. It is interesting to note that the rate of 16 - 24 and 35 - 44 buyers witnessed a sharp decline in this section compared to those purchasing for pop and rock, with the former occupied just a minority of a hundredth whereas the latter established approximately 2.5%.
I would utterly appreciate it if you score my essay as well.
british customers interested in purchasing music alums
The bar graphs give an overview about the percentages of British customers divided into sexes and ranges of age who pour their money on 3 different sorts of music albums. It can be clearly seen from the illustrations that pop and rock music are thoroughly trendy among male, 16 - 24, 25 - 34 and 35 - 44 users while classical one is preferred by 25 - 34 and 45+ purchasers.
According to the first 2 graphs, pop music and rock music share many similarities. Listeners ranging around 25 - 34 years old and 45+ years old made up the highest and lowest percentages respectively in both graphs. However, the figures for rock slightly overcome pop's ones.
Much as customers above 45 seem to pay little or those mentioned products, they bare the most striking characteristic in terms of classical music's sales. These people accounted or up to a fifth of the final graph, which means the budget they spend on this kind double that on the others. It is interesting to note that the rate of 16 - 24 and 35 - 44 buyers witnessed a sharp decline in this section compared to those purchasing for pop and rock, with the former occupied just a minority of a hundredth whereas the latter established approximately 2.5%.
I would utterly appreciate it if you score my essay as well.

10052010234202.jpg
