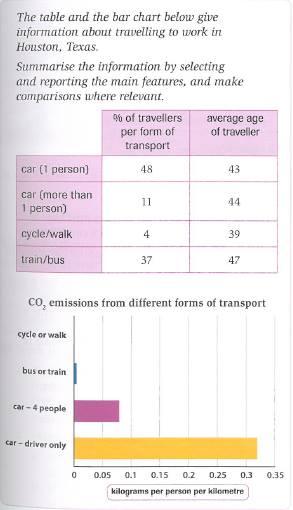
The table shows the percentage of employee which is going to work by four shapes of mode transportation in Houston, Texas; and the line chart experiences the amount of CO2 which is resulted as its residual gas and it is measured by kilogram per person per kilometer.
Car-driver only (48) and train/bus (37) take the first and second higher position in the percentage of travelers. Both of these numbers is almost similarly to the average age of the traveler.
There are two main trends in the number of output CO2 emissions. The first group to be the both of cars. While those have emissions more than 0.05 kilograms, car (driver only) produce over three times more than car (four people). The last group is bus/train and cycle/work. They virtually succeed to create zero emissions.
Overall, while car (driver only) has dominated in the percentage of daily worker in the number of, train/bus becoming stand at the first rank of the average of traveler. It can be seen that, person which is going to work by car-driver only producing the highest CO2 emissions.

12115973_11455715388.jpg
