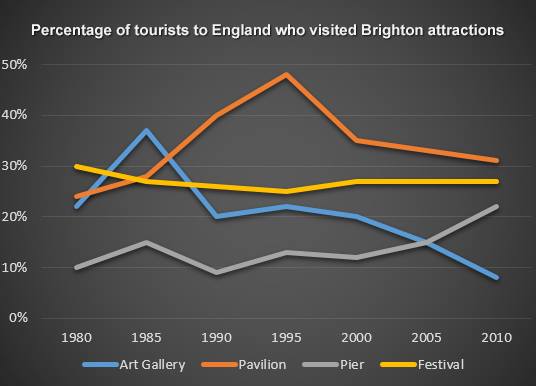
A breakdown of information about holiday maker percentage visiting England in Brighton from 1980 to 2010 as projected year is illustrated in the line graph. Overall, it can be seen that, despite some fluctuation, over the period as a whole the levels of tourists rose in Pavilion, Pier, Festival, exception being Art Gallery.
In 1980, the percentage of festival visitors stood at 30%, which the highest of three others attractions, while Pier as a lowest by one in ten. When there were gradual rise in level of visitors in Art Gallery, Pavilion, and Pier, but tourist festival decreased slightly. However, 1995 saw a striking different among all of attractions, the proportion of pavilion visitors increased dramatically whereas others remained stable. Yet, by 2000, once three attractions had had moderate changes, there had been a significant fall in the percentage of pavilion.
Less change was seen in remaining of four attractions between 2000 and 2010. Pavilion has the highest proportion and the lowest was art gallery, while pier and festival existed between both of them.

12932608_10201336223.jpg
