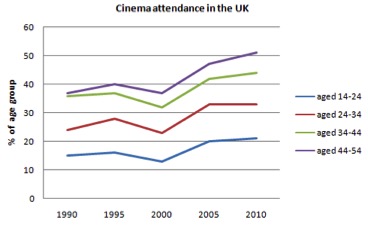
A breakdown of the percentage of the people going to the cinema in UK according to different age groups between 1990 and 2010 is presented in the line graph. Overall, UK cinema was dominated by people aged 44-54. Despite of the fluctuation, almost all figures showed nearly same patterns.
In 1990, the middle age people (34-44) and the oldest one stood at fairly similar proportion. This accounted for around 35%, while other age groups were fewer than 30%. By 2010, however, there had been some significant changes. The most noticeable one had been presented in the gap between the age group of 34-44 and the elderly people. It had widened out from 1% to about 8%. Meanwhile, the other figures had showed a less marked difference.
A closer look at the 2000, virtually all categories hit a low. The youngest group was by far the fewest, accounted for more or less 12%. Then, all of them rose significantly until the end of period. But the figure of people aged 24-34 stagnated at roughly 32%.

Untitled.jpg
