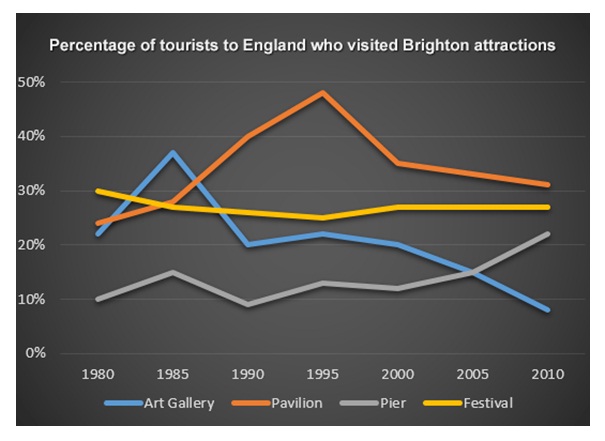
The line graph portrays the data regarding the proportion of visitors from four different attractions in Brighton, there are Art Gallery, Pavilion, Pier, and Festival. The data set starting from 1980 to 2010 and is measured in percentage. It is important to note that the percentage of visitors moved gradually and the Pavilion visitor reached a highest proportion of tourists in 1995.
To begin, the proportion of tourists who visited festival attractions in Brighton stood at 30%, it was the biggest value in 1980 than the other three attractions. However, this visitors attraction did not moved significantly, it was a slow declined between 20% and 30%. However, it increased slightly in 2000, leveling of at the same percentage for the remainder of the period. The percentage of Pier tourists has a similar trend, it began at 10% and then run fluctuated. It grew gradually starting from 2000 and overtook the Art Gallery visitors in 2005. In the of the period, it reached the percentage of Festival tourists.
Pavilion and Art Gallery have a same pattern, they began at level of between 20% and 30% in 1980. Both Art Gallery and Pavilion rose dramatically and hit a peak in 1985 for Art Gallery and in 1995 for Pavilion. Following this, they fell significantly and Art Gallery became the lowest performance who visited in Brighton. On the other hand, Pavilion unchanged this position and became the most attraction who visited in Brighton.

tourist_to_england.j.jpg
